I deposit $1000/mo into a Fidelity investment account, $48,000 total since 2022. I try to pick stocks to hold until retirement.
I decided I’m going to stop once I’ve invested $50,000 in February, mostly because I have no income, and then I’ll hold as long as I can. So the monthly updates will soon stop, though you’ll probably hear from me every once in a while.
I’m going to turn my energies to personal budgeting. I used to use Mint to budget, it was free, but they closed it down and I lost all that history. I tried Monarch for a year, but it costs money, which feels like it defeats the whole purpose. So I’m going to try loading my spending history into a spreadsheet each month. Oh no, another spreadsheet hobby, what have I done…
| Fund | 1-month | 3-month | 1 Year | 3 Year |
|---|---|---|---|---|
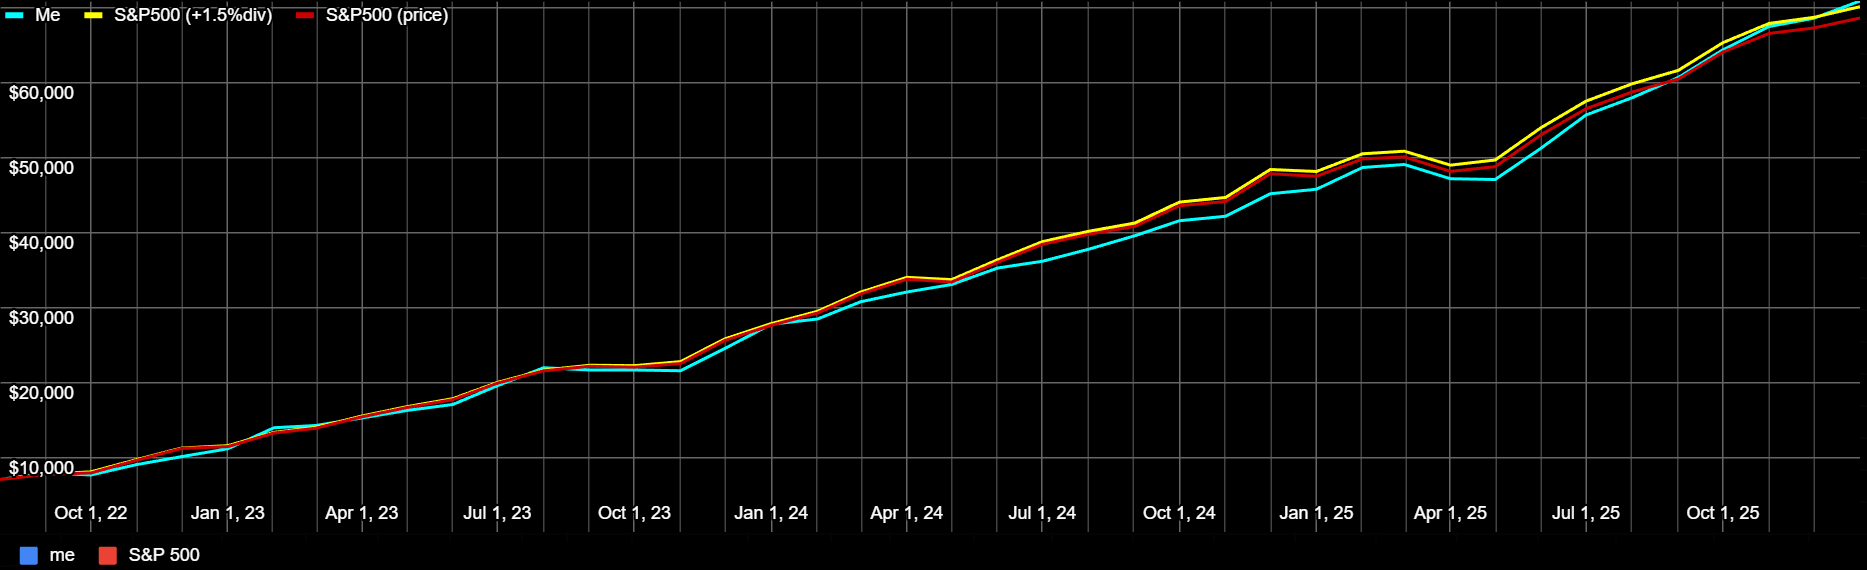
| My Fund | 0.6% | 3.9% | 22.8% | 84.4% |
| S&P 500 | 0.1% | 2.7% | 17.9% | 86.1% |
| Dow Jones | 0.0% | 2.4% | 17.1% | 82.8% |
The race remains close.
The YouTube channel Veritasium recently made a video about one of my holdings, ASML, and how they make “the world’s most important machine.” As a shareholder, I’m happy.
Sold
You’ve seen me sell small pieces of positions over the last few months. I’ve been tidying up my odd shares in anticipation of the $50k milestone, which I tell myself makes stock events easier to process, but mostly it makes me feel better. Only one sale this month.
| %pos> | thismo | shrs | cost | value | %price | tkr | div-f | description | acct% | cat | area | type |
|---|---|---|---|---|---|---|---|---|---|---|---|---|
| -23% | -$53 | 1 | $ 152 | $ 173 | 11% | TXN | 7.0% | TEXAS INSTR | 0.2% | tech | USA | sc’s |
Bought
I only bought 58 different stocks this month, and no new positions.
| # | %pos> | thismo | shrs | cost | value | %price | tkr | div-f | description | acct% | cat | area | type |
|---|---|---|---|---|---|---|---|---|---|---|---|---|---|
| 1 | 1% | $47 | 19.6 | $ 2,815 | $ 6,150 | 118% | GOOG | 0.9% | ALPHABET IN | 8.8% | multi | USA | tech |
| 2 | 2% | $91 | 29.5 | $ 3,773 | $ 5,502 | 46% | NVDA | 0.0% | NVIDIA CORP | 7.9% | tech | USA | sc’s |
| 3 | 1% | $57 | 19.4 | $ 3,712 | $ 5,274 | 42% | AAPL | 0.9% | APPLE INC | 7.6% | multi | USA | tech |
| 4 | 1% | $71 | 10 | $ 3,962 | $ 4,836 | 22% | MSFT | 1.3% | MICROSOFT C | 6.9% | multi | USA | tech |
| 5 | 1% | $47 | 16.55 | $ 2,964 | $ 3,820 | 29% | AMZN | 0.0% | AMAZON.COM | 5.5% | multi | USA | tech |
| 8 | 2% | $29 | 5.8 | $ 748 | $ 1,763 | 136% | TSM | 2.5% | TAIWAN SEMI | 2.5% | tech | Asia | sc’s |
| 13 | 2% | $17 | 2.2 | $ 626 | $ 772 | 23% | V | 1.1% | VISA INC | 1.1% | finance | USA | credit |
| 14 | 1% | $11 | 1.3 | $ 624 | $ 742 | 19% | MA | 0.8% | MASTERCARD | 1.1% | finance | USA | credit |
| 19 | 2% | $11 | 0.63 | $ 498 | $ 674 | 35% | ASML | 0.7% | ASML HOLDIN | 1.0% | tech | Europe | sc’s |
| 23 | 2% | $11 | 1.32 | $ 322 | $ 488 | 52% | AXP | 1.6% | AMERICAN EX | 0.7% | finance | USA | credit |
| 29 | 14% | $53 | 2 | $ 311 | $ 428 | 38% | AMD | 0.0% | ADVANCED MI | 0.6% | tech | USA | sc’s |
| 35 | 14% | $42 | 5 | $ 328 | $ 350 | 7% | KO | 4.0% | COCA-COLA C | 0.5% | retail | USA | food |
| 37 | 6% | $19 | 1.6 | $ 153 | $ 342 | 50% | TM | 5.0% | TOYOTA MOTO | 0.5% | industry | Asia | cars |
| 39 | 3% | $10 | 1.65 | $ 255 | $ 322 | 26% | ORCL | 1.4% | ORACLE CORP | 0.5% | tech | USA | cloud |
| 44 | 5% | $12 | 0.46 | $ 178 | $ 264 | 48% | CAT | 1.3% | CATERPILLAR | 0.4% | industry | USA | farm |
| 47 | 4% | $10 | 0.48 | $ 194 | $ 245 | 26% | MCO | 1.4% | MOODYS CORP | 0.4% | finance | USA | rating |
| 49 | 8% | $18 | 0.28 | $ 233 | $ 241 | 4% | COST | 0.7% | COSTCO WHOL | 0.3% | retail | USA | store |
| 50 | 7% | $15 | 0.46 | $ 205 | $ 240 | 17% | SPGI | 1.3% | S&P GLOBAL | 0.3% | finance | USA | rating |
| 51 | 5% | $11 | 0.68 | $ 175 | $ 240 | 37% | CEG | 0.5% | CONSTELLAT | 0.3% | energy | USA | nuclear |
| 54 | 7% | $15 | 1.65 | $ 263 | $ 237 | -10% | PEP | 3.4% | PEPSICO INC | 0.3% | retail | USA | food |
| 55 | 5% | $12 | 0.4 | $ 215 | $ 232 | 8% | TMO | 0.3% | THERMO FISH | 0.3% | health | USA | tech |
| 58 | 6% | $12 | 1.7 | $ 176 | $ 222 | 26% | BIDU | 0.0% | BAIDU INC S | 0.3% | tech | China | search |
| 60 | 5% | $10 | 0.67 | $ 199 | $ 219 | 10% | AMGN | 3.0% | AMGEN INC | 0.3% | health | USA | pharm |
| 62 | 7% | $13 | 0.45 | $ 215 | $ 218 | 1% | LMT | 2.7% | LOCKHEED MA | 0.3% | industry | USA | aero |
| 63 | 7% | $14 | 0.8 | $ 172 | $ 217 | 26% | ADI | 2.3% | ANALOG DEVI | 0.3% | tech | USA | sc’s |
| 64 | 7% | $14 | 0.7 | $ 152 | $ 216 | 42% | GE | 0.5% | GE AEROSPA | 0.3% | industry | USA | aero |
| 69 | 6% | $12 | 0.66 | $ 184 | $ 206 | 12% | CB | 1.0% | CHUBB LIMI | 0.3% | finance | USA | insure |
| 70 | 11% | $21 | 0.19 | $ 157 | $ 204 | 30% | LLY | 0.5% | ELI LILLY & | 0.3% | health | USA | pharm |
| 72 | 8% | $15 | 1.4 | $ 218 | $ 201 | -8% | PG | 3.5% | PROCTER AND | 0.3% | retail | USA | health |
| 75 | 25% | $38 | 1 | $ 208 | $ 195 | -6% | HON | 1.6% | HONEYWELL I | 0.3% | industry | USA | aero |
| 78 | 9% | $15 | 0.65 | $ 137 | $ 193 | 41% | IBM | 3.7% | INTERNATIO | 0.3% | tech | USA | multi |
| 81 | 7% | $11 | 0.8 | $ 152 | $ 183 | 20% | ABBV | 2.8% | ABBVIE INC | 0.3% | health | USA | pharm |
| 82 | 7% | $12 | 1.6 | $ 187 | $ 181 | -3% | PDD | 0.0% | PDD HOLDING | 0.3% | retail | China | tech |
| 84 | 9% | $14 | 0.38 | $ 158 | $ 177 | 12% | DE | 1.7% | DEERE & CO | 0.3% | industry | USA | farm |
| 90 | 9% | $13 | 1.2 | $ 138 | $ 165 | 20% | NVS | 1.2% | NOVARTIS A | 0.2% | health | Europe | biotech |
| 93 | 8% | $13 | 1.3 | $ 151 | $ 163 | 8% | ABT | 1.9% | ABBOTT LAB | 0.2% | health | USA | care |
| 94 | 8% | $12 | 0.7 | $ 168 | $ 162 | -3% | UNP | 2.6% | UNION PAC C | 0.2% | industry | USA | rail |
| 99 | 8% | $12 | 0.65 | $ 159 | $ 157 | -2% | LOW | 1.8% | LOWES COMPA | 0.2% | retail | USA | home |
| 100 | 9% | $13 | 0.6 | $ 115 | $ 154 | 34% | AMAT | 0.5% | APPLIED MA | 0.2% | tech | USA | sc’s |
| 103 | 13% | $18 | 0.45 | $ 130 | $ 152 | 16% | COR | 0.4% | CENCORA IN | 0.2% | health | USA | tech |
| 107 | 10% | $13 | 0.31 | $ 134 | $ 141 | 5% | VRTX | 0.0% | VERTEX PHA | 0.2% | health | USA | pharm |
| 110 | 8% | $10 | 0.39 | $ 113 | $ 131 | 16% | GD | 1.0% | GENERAL DY | 0.2% | industry | USA | aero |
| 115 | 10% | $11 | 0.35 | $ 134 | $ 120 | -10% | HD | 2.5% | HOME DEPOT | 0.2% | retail | USA | home |
| 116 | 10% | $11 | 0.21 | $ 112 | $ 120 | 7% | NOC | 0.9% | NORTHROP G | 0.2% | industry | USA | aero |
| 118 | 18% | $18 | 0.07 | $ 104 | $ 118 | 14% | FICO | 0.0% | FAIR ISAAC | 0.2% | finance | USA | credit |
| 120 | 11% | $11 | 0.33 | $ 122 | $ 116 | -5% | SYK | 0.5% | STRYKER CO | 0.2% | health | USA | tech |
| 124 | 12% | $11 | 0.19 | $ 92 | $ 108 | 16% | ISRG | 0.0% | INTUITIVE | 0.2% | health | USA | robo |
| 135 | 98% | $46 | 1 | $ 86 | $ 92 | 7% | AZN | 0.0% | ASTRAZENECA | 0.1% | health | Europe | pharm |
| 139 | 14% | $11 | 0.4 | $ 91 | $ 87 | -5% | NXPI | 1.1% | NXP SEMICO | 0.1% | tech | Europe | sc’s |
| 147 | 12% | $8 | 0.5 | $ 76 | $ 77 | 0% | NOW | 0.0% | SERVICENOW | 0.1% | tech | USA | cloud |
| 156 | 17% | $10 | 0.7 | $ 69 | $ 67 | -4% | BSX | 0.0% | BOSTON SCI | 0.1% | health | USA | tech |
| 157 | 19% | $11 | 0.3 | $ 65 | $ 66 | 1% | WM | 0.5% | WASTE MANAG | 0.1% | industry | USA | trash |
| 159 | 20% | $10 | 0.3 | $ 64 | $ 59 | -7% | NET | 0.0% | CLOUDFLARE | 0.1% | tech | USA | cloud |
| 161 | 42% | $17 | 0.1 | $ 65 | $ 58 | -10% | SPOT | 0.0% | SPOTIFY TEC | 0.1% | media | Europe | music |
| 165 | 34% | $13 | 0.2 | $ 49 | $ 52 | 6% | FSLR | 0.0% | FIRST SOLAR | 0.1% | energy | USA | solar |
| 173 | 26% | $9 | 0.5 | $ 45 | $ 44 | -1% | SRE | 0.1% | SEMPRA COM | 0.1% | energy | USA | util |
| 176 | 47% | $13 | 0.3 | $ 43 | $ 39 | -8% | ANET | 0.0% | ARISTA NETW | 0.1% | tech | USA | hw |
| 180 | 49% | $12 | 0.15 | $ 38 | $ 36 | -4% | SAP | 0.0% | SAP ADR REP | 0.1% | tech | Europe | sw |
All Holdings
See attached Technicolor PDF of All Holdings.