I deposit $1000/mo into a Fidelity investment account, $44,000 total since 2022. I try to pick stocks to hold until retirement.
My favorite book this month was The Radium Girls (Kate Moore, 2017). A little repetitive, but in that way it makes its point.
| Fund | 1-month | 3-month | 1 Year | 3 Year |
|---|---|---|---|---|
| My Fund | 2.8% | 12.0% | 19.0% | 54.4% |
| S&P 500 | 2.0% | 9.6% | 15.9% | 70.8% |
| Dow Jones | 2.3% | 10.0% | 15.9% | 67.8% |
Solid victory this month!
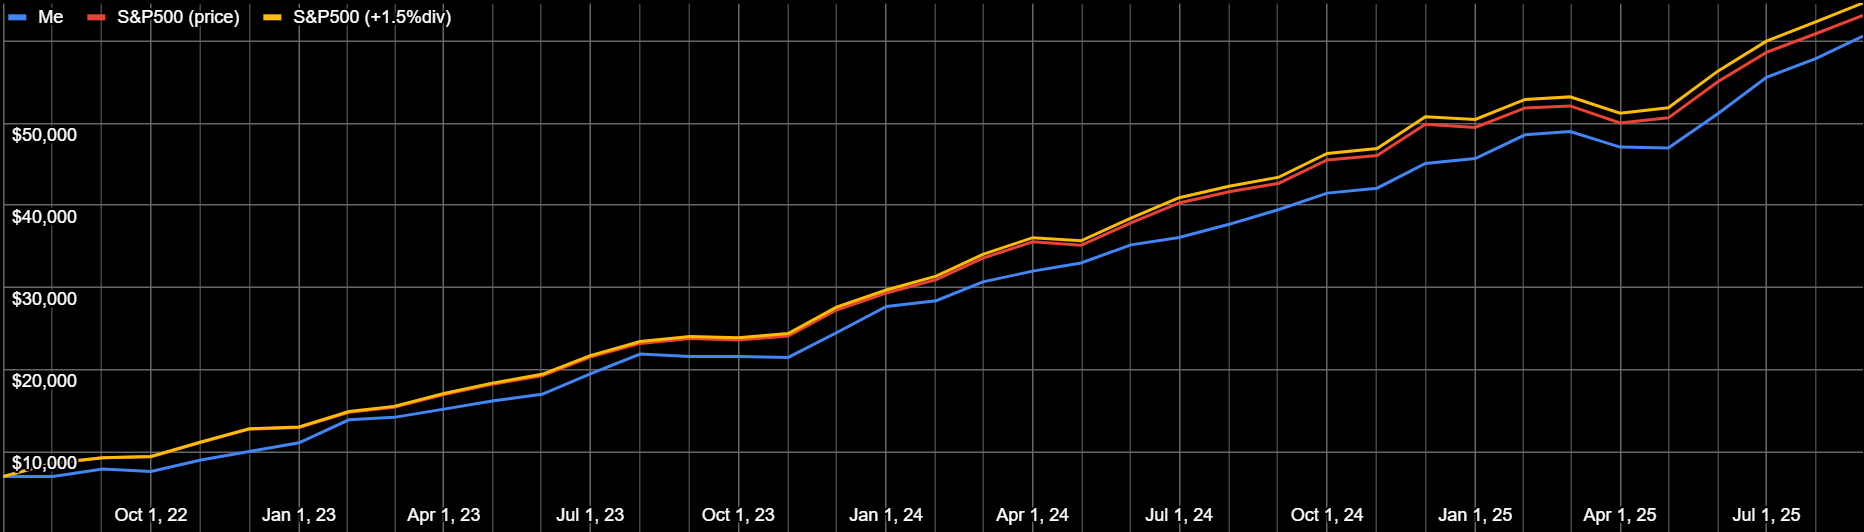
I’ve been thinking about how automatic deposits into an ETF never sleep. It takes me time to research and think and pick and buy, and in that time my money isn’t appreciating on the market.
I try to be quick about it each month, that’s what my spreadsheet helps me do, but I’m not perfect. I’ve been investing for three years now, 36 months, so if I average about a day late each month then I’m 36 days behind, about a month. (This would work in my favor if the market went down.)
I also didn’t start right on July 1st 2022, my first purchase was on the 18th, and on August 1st I still had $5k in cash. It wasn’t until the end of August that I had it all invested.
If I start the chart on August 1st 2022 (and I think I fixed an error that was giving the S&P500 each deposit a month early, probably the bigger issue here) then it looks like we’re about tied.
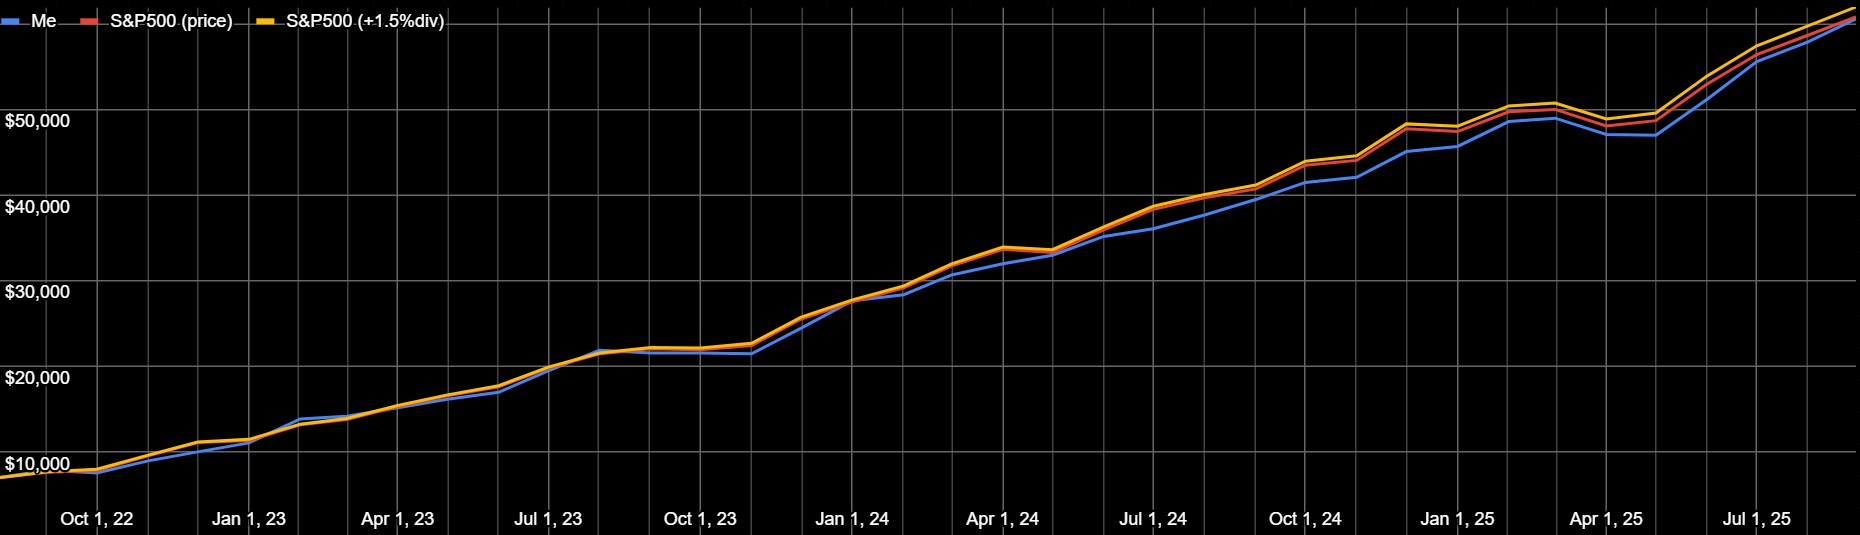
I’m still not sure that’s right, it doesn’t quite line up with the 3-year returns I’m seeing in the table above, so I’ll have to keep tinkering. This stuff is hard.
Bought
I “only” bought 58 positions this month, with one new position, Waste Management (WM). Chalk it up to watching The Sopranos recently, also it’s 15% of the Bill & Melinda Gates Foundation Trust.
| # | %pos> | thismo | shrs | cost | value | $gain | %price | tkr | div-f | description | acct% | cat | area | type |
|---|---|---|---|---|---|---|---|---|---|---|---|---|---|---|
| 1 | 1% | $47 | 9.55 | $ 3,737 | $ 4,801 | $ 1,100 | 28% | MSFT | 0.9% | MICROSOFT C | 8.0% | multi | USA | tech |
| 2 | 4% | $182 | 26 | $ 3,128 | $ 4,401 | $ 1,273 | 41% | NVDA | 0.0% | NVIDIA CORP | 7.4% | tech | USA | sc’s |
| 3 | 1% | $44 | 18.6 | $ 3,504 | $ 4,260 | $ 784 | 22% | AAPL | 0.8% | APPLE INC | 7.1% | multi | USA | tech |
| 4 | 1% | $49 | 18.75 | $ 2,599 | $ 3,932 | $ 1,349 | 51% | GOOG | 0.6% | ALPHABET IN | 6.6% | multi | USA | tech |
| 6 | 1% | $44 | 15.7 | $ 2,767 | $ 3,533 | $ 766 | 28% | AMZN | 0.0% | AMAZON.COM | 5.9% | multi | USA | tech |
| 7 | 3% | $47 | 3.67 | $ 1,534 | $ 1,835 | $ 301 | 20% | BRK.B | 0.0% | BERKSHIRE H | 3.1% | multi | USA | |
| 8 | 3% | $37 | 5.4 | $ 641 | $ 1,229 | $ 607 | 92% | TSM | 2.3% | TAIWAN SEMI | 2.1% | tech | Asia | sc’s |
| 11 | 2% | $13 | 17 | $ 1,019 | $ 817 | $ (171) | -20% | OXY | 3.0% | OCCIDENTAL | 1.4% | energy | USA | oil |
| 13 | 2% | $11 | 1.22 | $ 579 | $ 720 | $ 145 | 24% | MA | 0.7% | MASTERCARD | 1.2% | finance | USA | credit |
| 14 | 1% | $10 | 2.06 | $ 578 | $ 719 | $ 146 | 24% | V | 0.8% | VISA INC | 1.2% | finance | USA | credit |
| 20 | 6% | $31 | 1.75 | $ 287 | $ 521 | $ 237 | 81% | AVGO | 1.3% | BROADCOM IN | 0.9% | tech | USA | sc’s |
| 23 | 6% | $26 | 2.65 | $ 418 | $ 471 | $ 64 | 13% | JNJ | 2.6% | JOHNSON &JO | 0.8% | health | USA | goods |
| 25 | 3% | $12 | 1.2 | $ 280 | $ 395 | $ 118 | 41% | AXP | 1.5% | AMERICAN EX | 0.7% | finance | USA | credit |
| 26 | 6% | $21 | 0.54 | $ 419 | $ 391 | $ (25) | -7% | ASML | 0.6% | ASML HOLDIN | 0.7% | tech | Europe | sc’s |
| 31 | 3% | $11 | 3 | $ 336 | $ 346 | $ 26 | 3% | XOM | 4.8% | EXXON MOBIL | 0.6% | energy | USA | oil |
| 34 | 4% | $13 | 1.45 | $ 206 | $ 324 | $ 121 | 57% | ORCL | 1.3% | ORACLE CORP | 0.5% | tech | USA | cloud |
| 39 | 4% | $10 | 4 | $ 259 | $ 275 | $ 26 | 6% | KO | 3.4% | COCA-COLA C | 0.5% | retail | USA | food |
| 42 | 4% | $9 | 1.35 | $ 105 | $ 261 | $ 174 | 47% | TM | 4.7% | TOYOTA MOTO | 0.4% | industry | Asia | cars |
| 50 | 8% | $16 | 3 | $ 195 | $ 222 | $ 35 | 12% | CVS | 3.7% | CVS HEALTH | 0.4% | retail | USA | health |
| 56 | 5% | $10 | 0.22 | $ 177 | $ 206 | $ 31 | 17% | COST | 0.7% | COSTCO WHOL | 0.3% | retail | USA | store |
| 58 | 5% | $10 | 0.77 | $ 158 | $ 198 | $ 42 | 25% | TMUS | 1.2% | T-MOBILE US | 0.3% | media | USA | coms |
| 61 | 6% | $10 | 0.76 | $ 208 | $ 191 | $ (16) | -8% | CRM | 0.5% | SALESFORCE | 0.3% | tech | USA | cloud |
| 63 | 18% | $29 | 1 | $ 128 | $ 185 | $ 58 | 45% | VST | 0.5% | VISTRA COR | 0.3% | energy | USA | nuclear |
| 68 | 6% | $10 | 0.85 | $ 202 | $ 172 | $ (29) | -15% | DHR | 0.4% | DANAHER COR | 0.3% | health | USA | industry |
| 69 | 5% | $9 | 2 | $ 287 | $ 170 | $ (100) | -41% | UPS | 5.9% | UNITED PARC | 0.3% | industry | USA | post |
| 70 | 8% | $13 | 5 | $ 182 | $ 170 | $ (0) | -7% | CMCSA | 6.5% | COMCAST COR | 0.3% | media | USA | coms |
| 72 | 6% | $9 | 3.4 | $ 170 | $ 168 | $ 10 | -2% | SNY | 6.2% | SANOFI ADR | 0.3% | health | Europe | pharm |
| 73 | 6% | $9 | 1.8 | $ 131 | $ 167 | $ 36 | 27% | UBER | 0.0% | UBER TECHNO | 0.3% | tech | USA | rides |
| 74 | 6% | $10 | 0.54 | $ 128 | $ 164 | $ 37 | 28% | CEG | 0.4% | CONSTELLAT | 0.3% | energy | USA | nuclear |
| 75 | 6% | $9 | 0.36 | $ 173 | $ 162 | $ (7) | -6% | LMT | 1.9% | LOCKHEED MA | 0.3% | industry | USA | aero |
| 79 | 6% | $9 | 0.32 | $ 173 | $ 155 | $ (17) | -10% | TMO | 0.2% | THERMO FISH | 0.3% | health | USA | tech |
| 80 | 8% | $11 | 0.63 | $ 108 | $ 154 | $ 45 | 42% | DASH | 0.0% | DOORDASH I | 0.3% | tech | USA | retail |
| 81 | 6% | $9 | 0.37 | $ 133 | $ 154 | $ 22 | 15% | CAT | 1.3% | CATERPILLAR | 0.3% | industry | USA | farm |
| 82 | 6% | $9 | 0.52 | $ 154 | $ 149 | $ (2) | -4% | AMGN | 2.1% | AMGEN INC | 0.2% | health | USA | pharm |
| 83 | 8% | $11 | 1.2 | $ 136 | $ 146 | $ 10 | 7% | PDD | 0.0% | PDD HOLDING | 0.2% | tech | China | retail |
| 87 | 8% | $11 | 0.65 | $ 139 | $ 141 | $ 4 | 2% | HON | 1.2% | HONEYWELL I | 0.2% | industry | USA | aero |
| 88 | 6% | $8 | 0.5 | $ 139 | $ 138 | $ 0 | -1% | CB | 0.9% | CHUBB LIMI | 0.2% | finance | USA | insure |
| 90 | 11% | $14 | 0.5 | $ 93 | $ 136 | $ 43 | 46% | GE | 0.5% | GE AEROSPA | 0.2% | industry | America | aero |
| 97 | 17% | $19 | 2 | $ 92 | $ 128 | $ 44 | 39% | HSBC | 8.7% | HSBC HLDGS | 0.2% | finance | Europe | bank |
| 99 | 8% | $10 | 0.6 | $ 108 | $ 127 | $ 22 | 18% | ABBV | 2.8% | ABBVIE INC | 0.2% | health | USA | pharm |
| 102 | 9% | $11 | 0.79 | $ 101 | $ 125 | $ 25 | 24% | RTX | 0.8% | RTX CORPOR | 0.2% | industry | USA | aero |
| 105 | 26% | $25 | 1 | $ 113 | $ 122 | $ 11 | 8% | DUK | 1.7% | DUKE ENERG | 0.2% | energy | Europe | util |
| 108 | 11% | $12 | 1.4 | $ 142 | $ 119 | $ (21) | -16% | MRK | 1.9% | MERCK &CO. | 0.2% | health | America | pharm |
| 115 | 12% | $11 | 1.85 | $ 187 | $ 104 | $ (80) | -44% | NVO | 1.1% | NOVO NORDIS | 0.2% | health | Europe | pharm |
| 116 | 14% | $12 | 0.8 | $ 86 | $ 101 | $ 16 | 17% | NVS | 2.0% | NOVARTIS A | 0.2% | health | Europe | biotech |
| 124 | 11% | $9 | 1 | $ 84 | $ 92 | $ 10 | 9% | SO | 2.0% | SOUTHERN C | 0.2% | energy | USA | util |
| 127 | 12% | $9 | 0.27 | $ 73 | $ 87 | $ 16 | 20% | GD | 0.9% | GENERAL DY | 0.1% | industry | USA | aero |
| 131 | 19% | $13 | 0.12 | $ 78 | $ 83 | $ 5 | 6% | MCK | 0.1% | MCKESSON C | 0.1% | health | USA | tech |
| 134 | 9% | $7 | 0.11 | $ 89 | $ 81 | $ (8) | -9% | LLY | 0.4% | ELI LILLY & | 0.1% | health | USA | pharm |
| 137 | 18% | $12 | 0.13 | $ 66 | $ 77 | $ 11 | 17% | NOC | 0.5% | NORTHROP G | 0.1% | industry | USA | aero |
| 144 | 16% | $10 | 0.75 | $ 62 | $ 73 | $ 11 | 17% | LRCX | 0.4% | LAM RESEAR | 0.1% | tech | USA | sc’s |
| 145 | 20% | $12 | 0.18 | $ 80 | $ 72 | $ (8) | -11% | VRTX | 0.0% | VERTEX PHA | 0.1% | health | USA | pharm |
| 154 | 17% | $8 | 0.35 | $ 59 | $ 55 | $ (4) | -7% | AMAT | 0.3% | APPLIED MA | 0.1% | tech | USA | sc’s |
| 170 | 35% | $10 | 0.08 | $ 39 | $ 37 | $ (2) | -5% | ISRG | 0.0% | INTUITIVE | 0.1% | health | USA | robo |
| 176 | 52% | $10 | 0.12 | $ 30 | $ 29 | $ (2) | -5% | EFX | 0.1% | EQUIFAX IN | 0.0% | finance | USA | credit |
| 177 | 63% | $10 | 0.25 | $ 25 | $ 27 | $ 2 | 8% | BSX | 0.0% | BOSTON SCI | 0.0% | health | USA | tech |
| 178 | 112% | $11 | 0.1 | $ 21 | $ 21 | $ (0) | 0% | NET | 0.0% | CLOUDFLARE | 0.0% | tech | USA | cloud |
| 179 | new | $11 | 0.05 | $ 11 | $ 11 | $ (0) | -1% | WM | 0.0% | WASTE MANAG | 0.0% | industry | USA | trash |
Sold
I sold out of one position this month, Texas Roadhouse, because the streamer that turned me onto it sold some and I need more conviction in my holdings.
| %pos> | thismo | cost | value | $gain | %price | tkr | div-f | description | acct% | cat | area | type |
|---|---|---|---|---|---|---|---|---|---|---|---|---|
| -100% | -$43 | $ (9) | $ - | $ 9 | 24% | TXRH | 2.6% | TEXAS ROADH | 0.0% | retail | USA | food |
All Holdings
See the attached PDF of my holdings, it’s colorful.