I deposit $1000/mo into a Fidelity investment account, $27,000 total since 2022. I try to pick stocks to hold until retirement.
| Fund | 1-month | 3-month | 1-year |
|---|---|---|---|
| My Fund | 4.7% | 7.5% | 24.8% |
| S&P 500 | 3.2% | 10.6% | 29.9% |
| Dow Jones | 3.2% | 10.1% | 29.4% |
We shouldn’t read much into 1-month performance, it’s high variance and we’re on a much longer timeline…
…wait I beat the market this month? LET’S GOOOOO

This wraps up 2024 Q1 (in which I lost to the market)
| QTR | Me* | S&P 500 |
|---|---|---|
| Q3 22 | 6.4% | 7.5% |
| Q1 23 | 9.9% | 7.5% |
| Q2 23 | 7.1% | 8.7% |
| Q3 23 | -3.5% | -3.3% |
| Q4 23 | 12.3% | 11.7% |
| Q1 24 | 7.5% | 10.2% |
*Time-weighted rate-of-return
Sold
I sold a few more positions this month, just $428 total, about 1.3% of my account value. Slow and steady consolidation.
I made a profit on Robinhood (after holding for over a year) but I prefer my other finance picks going forward. Zoom isn’t profitable, and I don’t really understand the other three.
| $sold | $gain | %gain | tkr | div | description | cat | area | type |
|---|---|---|---|---|---|---|---|---|
| $ 255 | $ 115 | 82% | HOOD | 0.0% | ROBINHOOD M | finance | USA | tech |
| $ 71 | $ (11) | -13% | ZM | 0.0% | ZOOM VIDEO | tech | USA | app |
| $ 50 | $ (8) | -12% | HIW | 9.5% | HIGHWOODS P | industry | USA | office |
| $ 42 | $ (32) | -44% | CDLX | 0.0% | CARDLYTICS | tech | USA | ads |
| $ 11 | $ (3) | -19% | SHYF | 1.1% | SHYFT GROUP | cars | USA | special |
Buys
Here are my buys this month, sorted by how much I bought.
The Rank column is that position’s rank by value in my account. META is rank 1. The +pos column is trying to show how much I increased that position, though it’s wonky because it’s using current value rather than value at the time. (Too many historical price lookups kill the sheet.)
| rank | +pos | buy | shrs | spent | value | $gain | %gain | tkr | div | description | acct% | cat | area | type |
|---|---|---|---|---|---|---|---|---|---|---|---|---|---|---|
| 4 | 15% | $160 | 6.2 | $ 1,000 | $ 1,063 | $ 67 | 7% | AAPL | 0.4% | APPLE INC | 3.2% | tech | USA | mag7 |
| 6 | 18% | $159 | 5 | $ 744 | $ 902 | $ 158 | 21% | AMZN | 0.0% | AMAZON.COM | 2.7% | tech | USA | mag7 |
| 2 | 10% | $151 | 9.8 | $ 1,060 | $ 1,492 | $ 432 | 41% | GOOG | 0.0% | ALPHABET IN | 4.5% | tech | USA | mag7 |
| 8 | 24% | $143 | 1.4 | $ 529 | $ 589 | $ 60 | 11% | BRK.B | 0.0% | BERKSHIRE H | 1.8% | multi | USA | |
| 3 | 13% | $140 | 2.54 | $ 794 | $ 1,069 | $ 279 | 35% | MSFT | 0.6% | MICROSOFT C | 3.2% | tech | USA | mag7 |
| 46 | 24% | $48 | 4 | $ 197 | $ 200 | $ 4 | 2% | CSCO | 0.2% | CISCO SYSTE | 0.6% | coms | USA | |
| 20 | 9% | $35 | 10 | $ 376 | $ 390 | $ 24 | 6% | TCEHY | 2.7% | TENCENT HOL | 1.2% | tech | China | games |
| 92 | 35% | $33 | 0.2 | $ 93 | $ 96 | $ 4 | 4% | MA | 0.0% | MASTERCARD | 0.3% | finance | USA | credit |
| 93 | 32% | $30 | 0.24 | $ 90 | $ 94 | $ 4 | 5% | MCO | 0.2% | MOODYS CORP | 0.3% | finance | USA | rate |
| 97 | 34% | $30 | 0.21 | $ 90 | $ 89 | $ (0) | 0% | SPGI | 0.1% | S&P GLOBAL | 0.3% | finance | USA | analyze |
| 171 | 118% | $29 | 0.15 | $ 29 | $ 24 | $ (4) | -16% | SNOW* | 0.0% | SNOWFLAKE I | 0.1% | tech | USA | cloud |
| 101 | 34% | $28 | 0.3 | $ 83 | $ 84 | $ 1 | 1% | V | 0.1% | VISA INC | 0.3% | finance | USA | credit |
| 33 | 9% | $23 | 9 | $ 269 | $ 247 | $ (23) | -8% | JD | 0.0% | JD.COM INC | 0.7% | tech | China | retail |
| 24 | 6% | $22 | 4.8 | $ 404 | $ 347 | $ (54) | -13% | BABA | 0.7% | ALIBABA GRO | 1.1% | tech | China | retail |
| 123 | 38% | $22 | 0.08 | $ 58 | $ 59 | $ 0 | 1% | COST | 0.0% | COSTCO WHOL | 0.2% | retail | USA | value |
| 147 | 51% | $20 | 0.06 | $ 39 | $ 39 | $ (0) | 0% | INTU | 0.0% | INTUIT INC | 0.1% | tech | USA | sw |
| 151 | 51% | $19 | 0.03 | $ 38 | $ 37 | $ (1) | -2% | FICO | 0.0% | FAIR ISAAC | 0.1% | tech | USA | analyze |
| 162 | 53% | $14 | 0.02 | $ 26 | $ 27 | $ 0 | 0% | AVGO | 0.0% | BROADCOM IN | 0.1% | tech | USA | sc’s |
| 165 | 50% | $13 | 0.2 | $ 25 | $ 26 | $ 1 | 4% | NVO | 0.0% | NOVO NORDIS | 0.1% | health | Europe | pharm |
| 168 | 52% | $13 | 0.1 | $ 25 | $ 25 | $ (0) | -2% | UNP | 0.0% | UNION PAC C | 0.1% | travel | USA | rail |
| 166 | 48% | $12 | 0.1 | $ 23 | $ 25 | $ 2 | 10% | LOW | 0.0% | LOWES COMPA | 0.1% | retail | USA | home |
| 167 | 45% | $11 | 0.2 | $ 23 | $ 25 | $ 2 | 10% | ORCL | 0.0% | ORACLE CORP | 0.1% | tech | USA | corp |
| 200 | 98% | $11 | 0.04 | $ 11 | $ 11 | $ 0 | 2% | AMGN* | 0.0% | AMGEN INC | 0.0% | health | USA | pharm |
| 180 | 53% | $11 | 0.2 | $ 21 | $ 21 | $ (0) | -2% | NTES | 0.0% | NETEASE INC | 0.1% | tech | China | games |
| 89 | 11% | $11 | 0.45 | $ 81 | $ 102 | $ 22 | 27% | AXP | 0.2% | AMERICAN EX | 0.3% | finance | USA | credit |
| 49 | 6% | $11 | 1.6 | $ 177 | $ 186 | $ 15 | 8% | XOM | 2.9% | EXXON MOBIL | 0.6% | energy | USA | oil |
| 127 | 20% | $11 | 0.019 | $ 50 | $ 55 | $ 5 | 11% | CMG | 0.0% | CHIPOTLE ME | 0.2% | food | USA | retail |
| 175 | 48% | $11 | 0.02 | $ 21 | $ 23 | $ 2 | 7% | ORLY | 0.0% | OREILLY AUT | 0.1% | cars | USA | parts |
| 178 | 49% | $11 | 0.2 | $ 21 | $ 22 | $ 1 | 4% | SWKS | 0.3% | SKYWORKS SO | 0.1% | tech | USA | sc’s |
| 129 | 19% | $10 | 0.5 | $ 55 | $ 53 | $ (2) | -4% | BIDU | 0.0% | BAIDU INC S | 0.2% | tech | China | search |
| 179 | 49% | $10 | 0.18 | $ 23 | $ 21 | $ (2) | -9% | PDD | 0.0% | PDD HOLDING | 0.1% | tech | China | retail |
| 209 | 97% | $10 | 0.05 | $ 10 | $ 10 | $ 0 | 3% | HON* | 0.0% | HONEYWELL I | 0.0% | tech | USA | aero |
| 108 | 14% | $10 | 0.41 | $ 69 | $ 72 | $ 3 | 4% | PEP | 0.0% | PEPSICO INC | 0.2% | food | USA | cola |
| 182 | 50% | $10 | 0.11 | $ 20 | $ 20 | $ (1) | -3% | AMD | 0.0% | ADVANCED MI | 0.1% | tech | USA | sc’s |
| 211 | 99% | $10 | 0.04 | $ 10 | $ 10 | $ 0 | 1% | ADP* | 0.0% | AUTOMATIC D | 0.0% | tech | USA | serve |
| 183 | 49% | $10 | 0.1 | $ 19 | $ 20 | $ 1 | 4% | ADI | 0.3% | ANALOG DEVI | 0.1% | tech | USA | sc’s |
| 32 | 4% | $10 | 3.76 | $ 274 | $ 252 | $ (22) | -8% | PYPL | 0.0% | PAYPAL HLDG | 0.8% | finance | USA | tech |
| 70 | 8% | $10 | 0.26 | $ 136 | $ 129 | $ (7) | -5% | UNH | 0.4% | UNITEDHEALT | 0.4% | health | USA | insure |
| 98 | 11% | $10 | 1.46 | $ 90 | $ 89 | $ 1 | 1% | KO | 1.0% | COCA-COLA C | 0.3% | food | USA | cola |
| 50 | 5% | $9 | 1.05 | $ 204 | $ 185 | $ (19) | -9% | TSLA | 0.0% | TESLA INC C | 0.6% | cars | USA | mag7 |
| 137 | 21% | $9 | 0.5 | $ 47 | $ 46 | $ (1) | -3% | SBUX | 0.2% | STARBUCKS C | 0.1% | food | USA | retail |
| 164 | 36% | $9 | 0.6 | $ 27 | $ 26 | $ (1) | -4% | STM | 0.1% | STMICROELEC | 0.1% | tech | Europe | sc’s |
| 110 | 13% | $9 | 2.3 | $ 71 | $ 69 | $ (2) | -3% | VICI | 0.0% | VICI PPTYS | 0.2% | travel | USA | vegas |
| 144 | 21% | $9 | 0.15 | $ 43 | $ 42 | $ (1) | -2% | MCD | 0.5% | MCDONALD S | 0.1% | food | USA | retail |
| 135 | 18% | $9 | 1.2 | $ 46 | $ 48 | $ 2 | 5% | YUMC | 0.4% | YUM CHINA H | 0.1% | food | China | |
| 140 | 20% | $9 | 0.5 | $ 41 | $ 44 | $ 3 | 8% | CP | 0.0% | CANADIAN PA | 0.1% | travel | America | rail |
| 62 | 6% | $8 | 0.16 | $ 91 | $ 145 | $ 54 | 60% | NVDA | 0.0% | NVIDIA CORP | 0.4% | tech | USA | mag7 |
| 75 | 7% | $8 | 0.75 | $ 120 | $ 119 | $ (1) | -1% | JNJ | 0.7% | JOHNSON &JO | 0.4% | health | USA | |
| 84 | 8% | $8 | 0.65 | $ 99 | $ 105 | $ 7 | 7% | PG | 0.5% | PROCTER AND | 0.3% | retail | USA | health |
| 177 | 36% | $8 | 0.3 | $ 23 | $ 22 | $ (1) | -3% | ON | 0.0% | ON SEMICOND | 0.1% | tech | USA | sc’s |
| 157 | 24% | $8 | 4 | $ 31 | $ 32 | $ 1 | 4% | UMC | 0.0% | UNITED MICR | 0.1% | tech | Asia | sc’s |
| 215 | 101% | $8 | 0.01 | $ 8 | $ 8 | $ (0) | -1% | NOW* | 0.0% | SERVICENOW | 0.0% | tech | USA | cloud |
| 186 | 40% | $8 | 0.05 | $ 18 | $ 19 | $ 1 | 5% | HD | 0.6% | HOME DEPOT | 0.1% | retail | USA | home |
| 155 | 23% | $8 | 0.13 | $ 32 | $ 32 | $ 0 | 1% | DHR | 0.0% | DANAHER COR | 0.1% | industry | USA | health |
| 133 | 15% | $7 | 0.12 | $ 47 | $ 49 | $ 3 | 6% | DE | 0.0% | DEERE & CO | 0.1% | industry | USA | farm |
| 159 | 24% | $7 | 0.2 | $ 27 | $ 31 | $ 4 | 14% | TXRH | 0.4% | TEXAS ROADH | 0.1% | food | USA | retail |
| 14 | 2% | $7 | 3.05 | $ 477 | $ 481 | $ 20 | 4% | CVX | 3.2% | CHEVRON COR | 1.5% | energy | USA | oil |
| 185 | 25% | $5 | 4 | $ 40 | $ 19 | $ (20) | -49% | SAVE | 2.5% | SPIRIT AIRL | 0.1% | travel | USA | air |
*New positions
I’m still expanding Apple, Amazon, Google, Microsoft, and Berkshire the most. CSCO still has attractive fundamentals. I’m still taking small bites out of China tech, like Tencent and Alibaba. Still excited about my financial picks: Mastercard, Moody’s, S&P Global, Visa, American Express.
More semiconductor spreads: AVGO, SWKS, AMD, ADI, STM, ON, UMC. A little bit of food and retail I can stand: Costco, Starbucks, McDonalds, Pepsi, Coke, Walmart, Chipotle, Texas Roadhouse. A smattering of healthcare. Tiny bites of energy. A tiny bite of Tesla.
I like my picks this month. I’ve got my choices organized and now I can take it slow and follow the plan.
Overview
Here’s a screenshot of my overview tab, now featuring Q1 2024 performance in the chart.
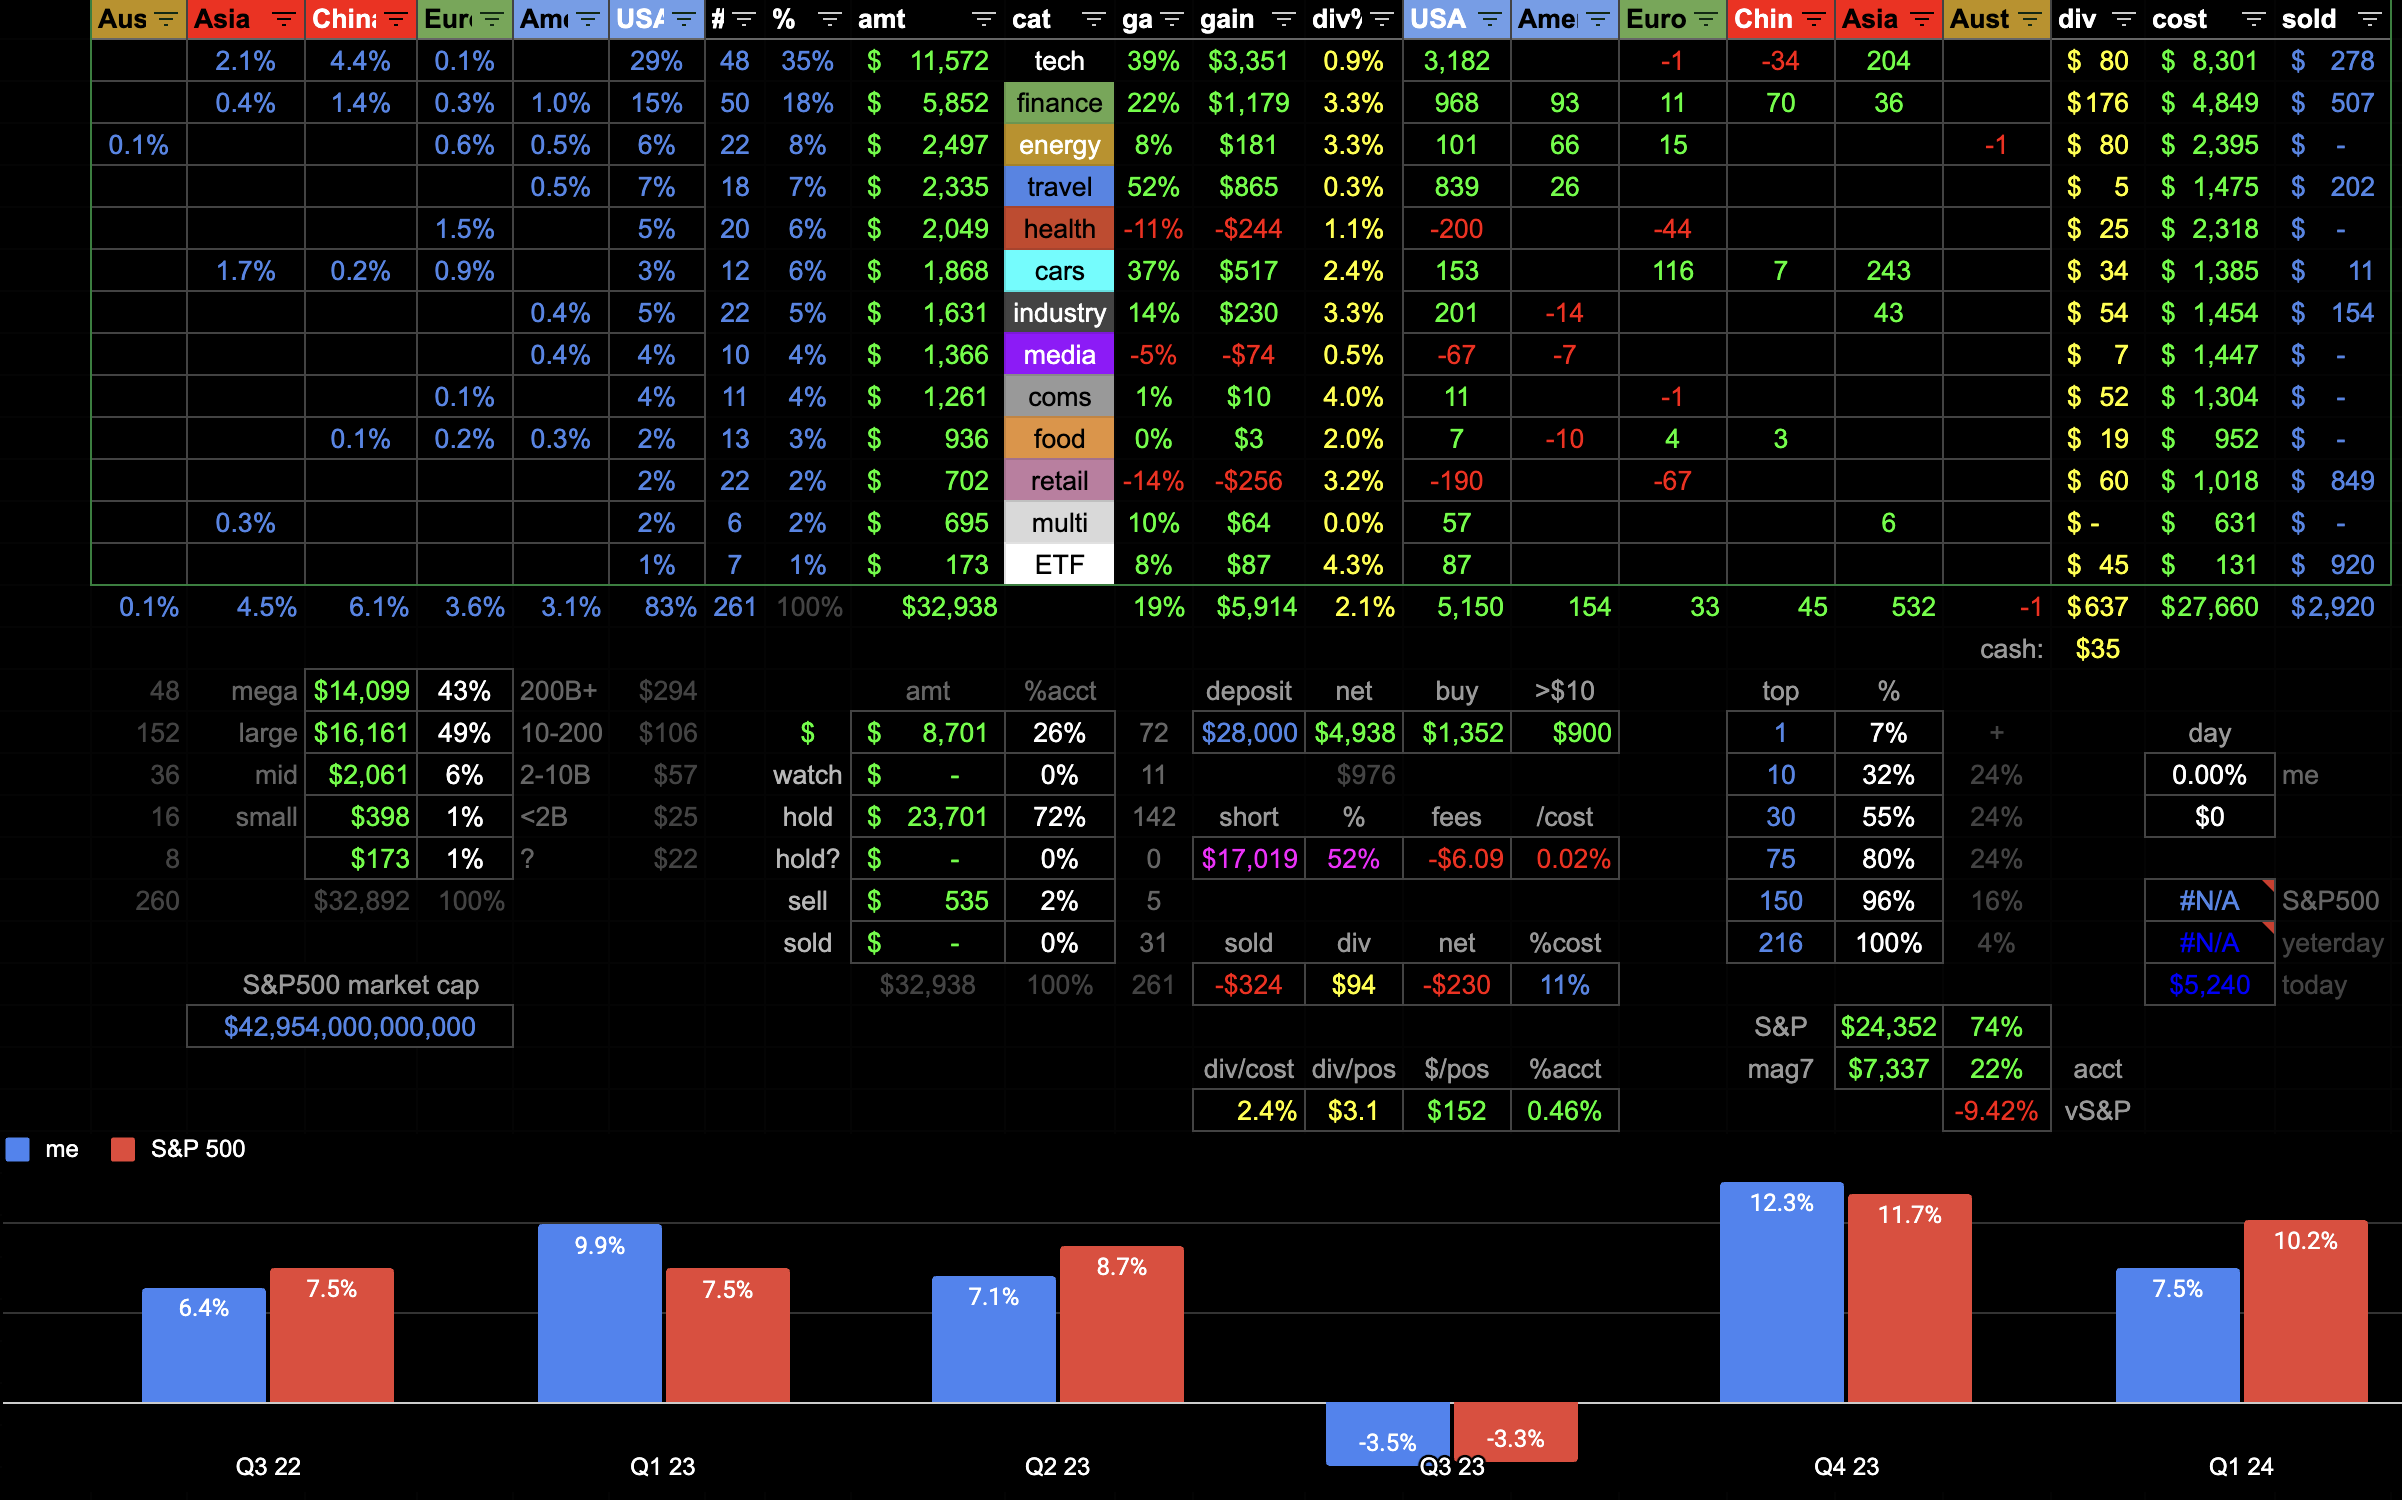
I also rebuilt some of my graphs that were lost in the great sheet crash of February ‘24.
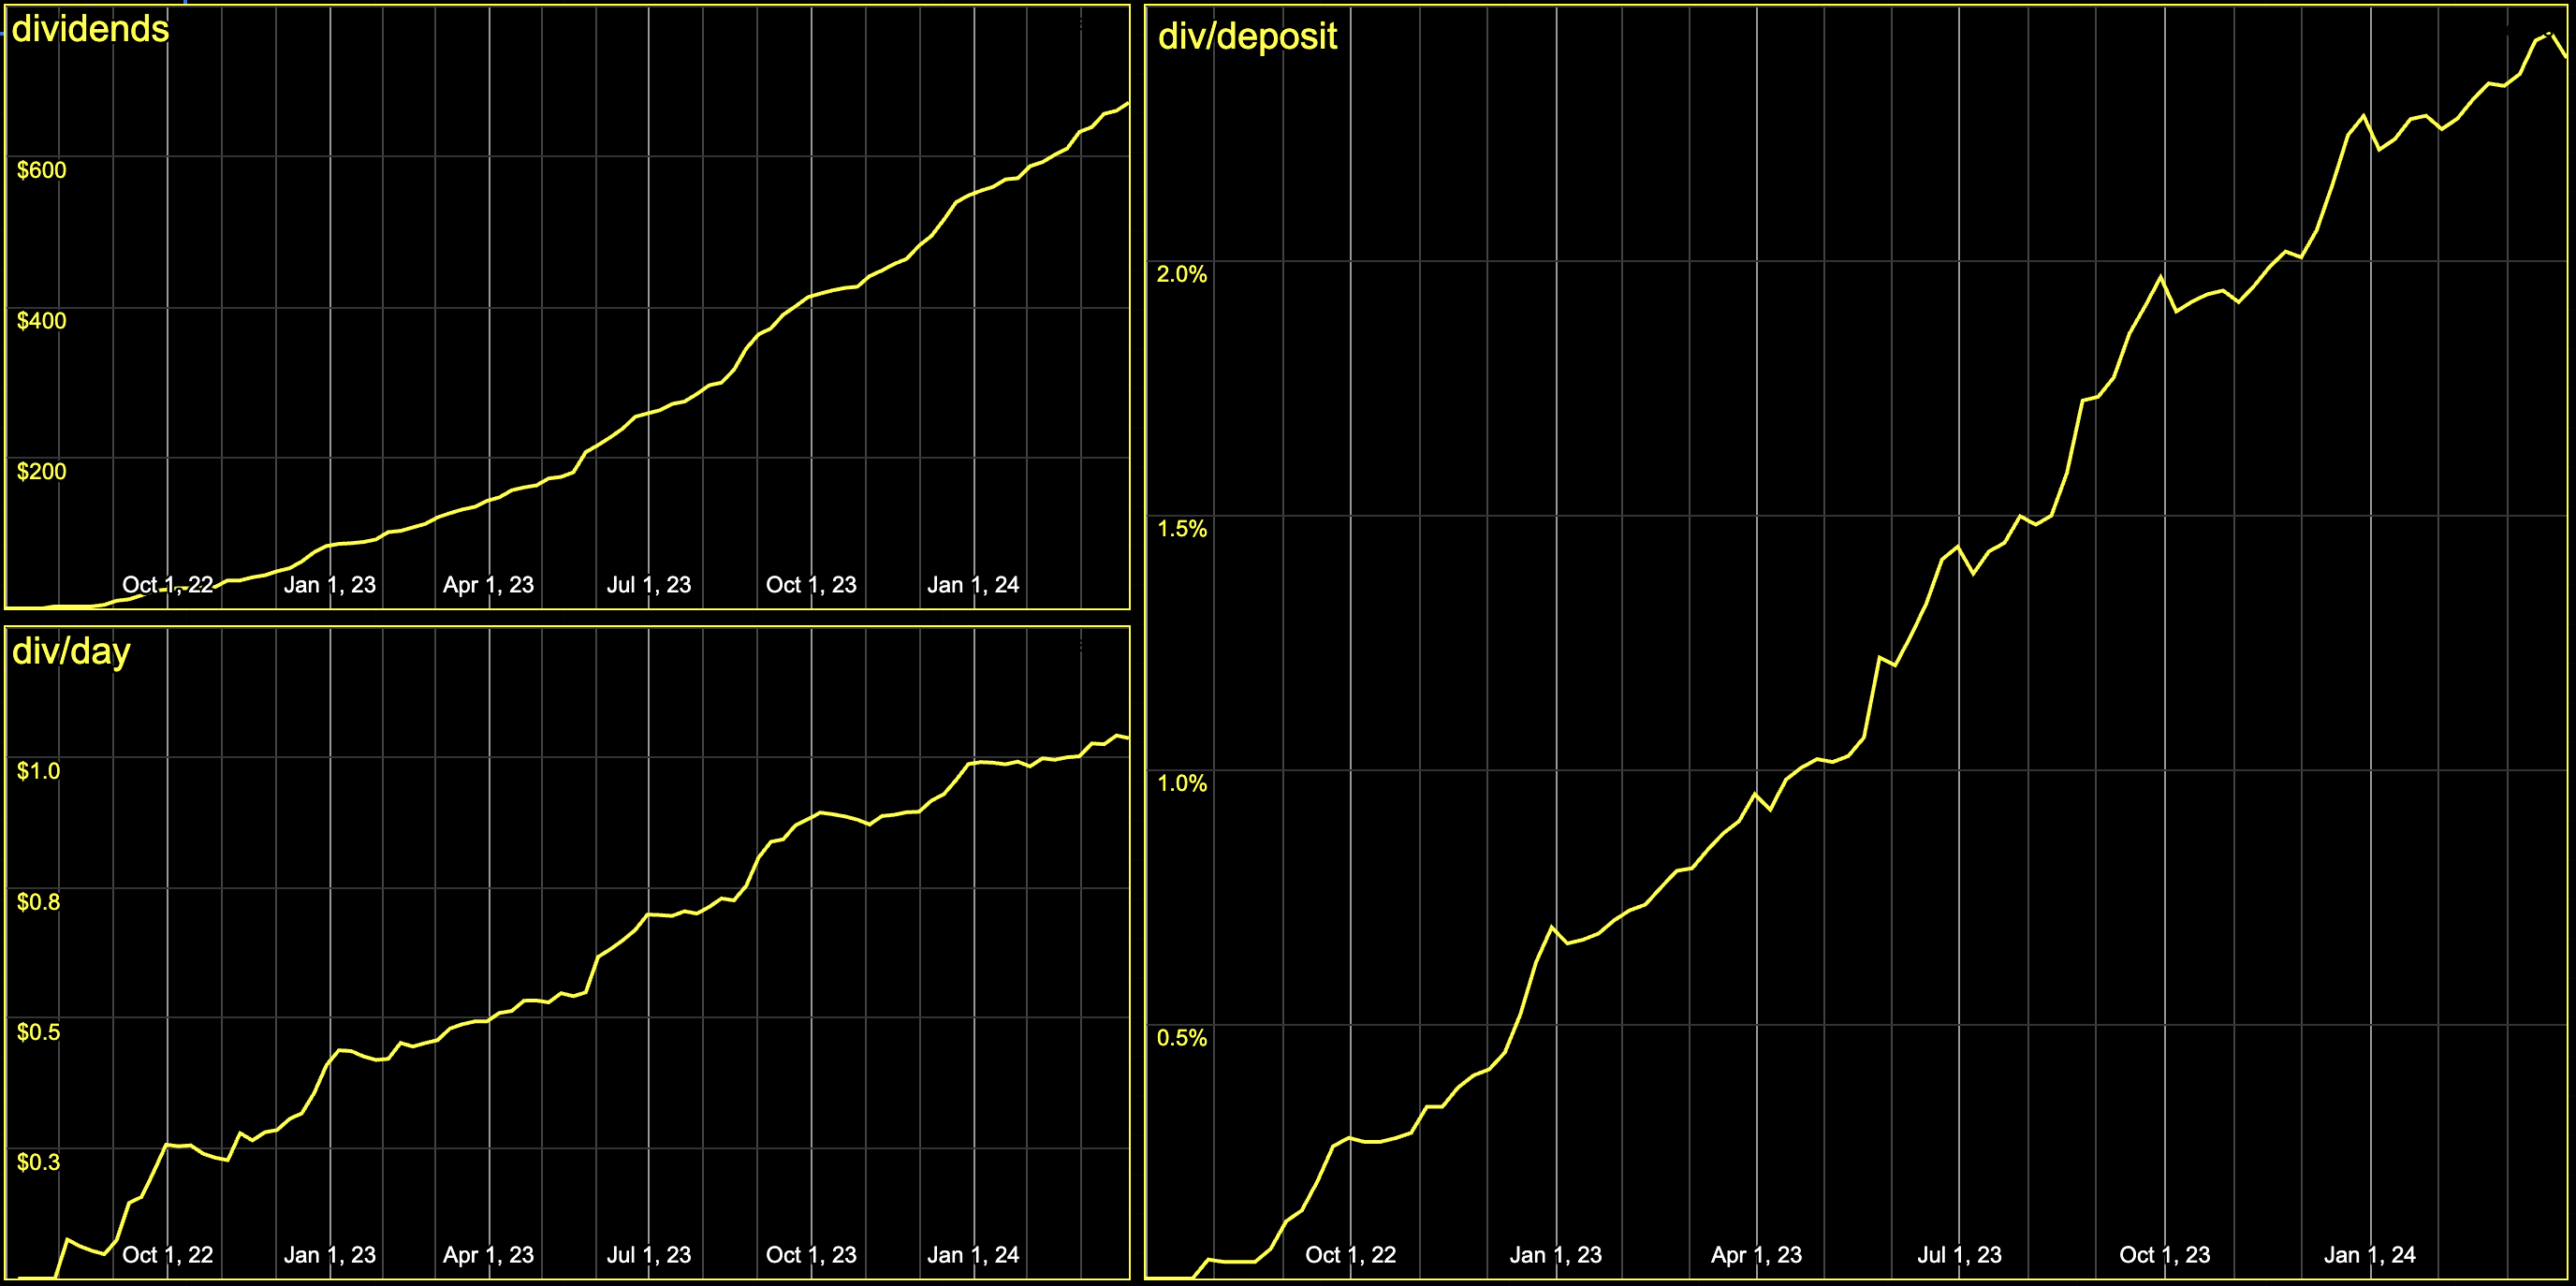
Here you can see my total dividends, the average earned per day, and the rate earned relative to my total deposit. I suspect that last graph should level out around 2.5% now.
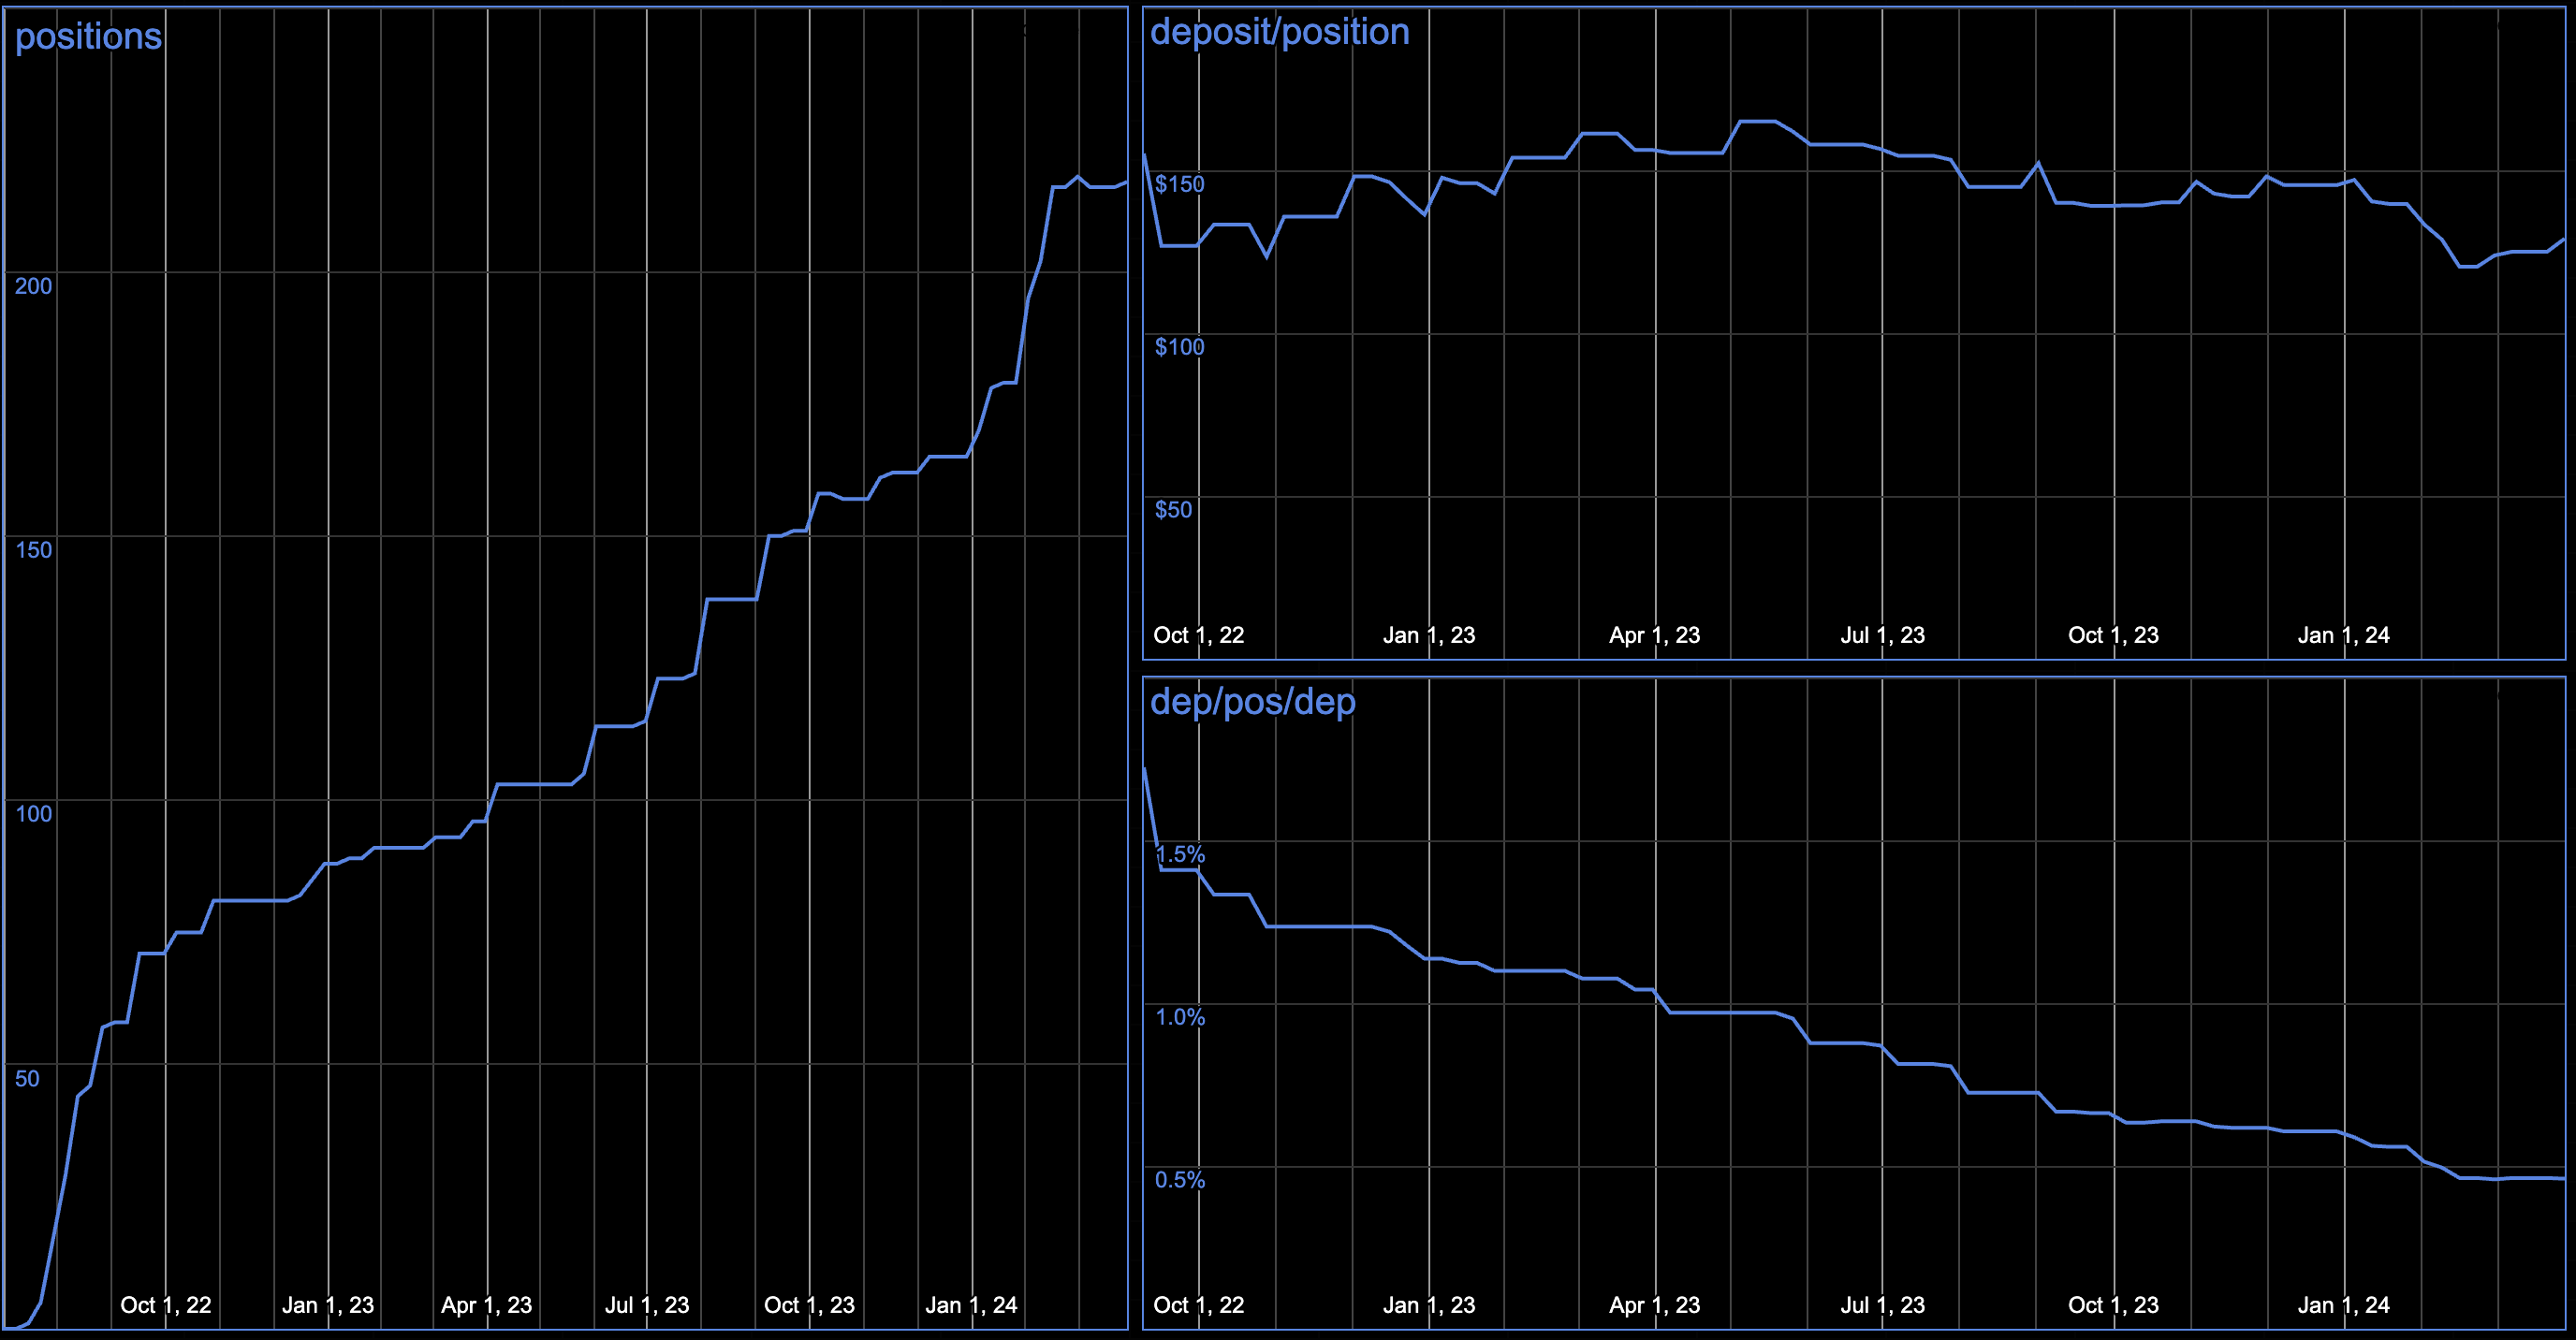
These graphs show my total number of positions, their average size, and their average size relative to how much I’ve deposited. I’m hoping the right graphs will trend up as I consolidate.
Holdings
Here is a PDF export of a slice of my sheet, covering my current holdings. I’d be happy to answer any questions!
Thanks for reading, Jon