I put $1000 a month into a Fidelity investment account, and have invested $26,000 since 2022. I try to pick stocks to hold to retirement. I posted my old emails here. (I think I fixed every time I misspelled Buffett.)
Me reading the old emails:

We passed $30k this month! We’re still behind the S&P 500 this year, though.
| Fund | 1-month | 3-month | YTD | 1-year |
|---|---|---|---|---|
| My Fund | 3.9% | 11.4% | 2.7% | 19.2% |
| S&P 500 | 5.3% | 12.0% | 7.1% | 30.5% |
| Dow Jones | 5.4% | 16.3% | 6.6% | 28.6% |
Last month I showed the performance of my Wealthfront ETF account, where I was investing a matching $1000/mo to hedge against the gamble of picking my own stocks. I just stopped that deposit while I lack income, though I’m still excited to compare performance. I should have a few years before this fund would be big enough to be risky.
I read four investment books this month. Peter Lynch’s One Up on Wall Street (good explanation of stock types ex: cyclical, turnarounds) and Beating the Street (the stories felt old), The Philosophy of Money (fine but soft), and Richer, Wiser Happier (interviews eccentric investors, the one I recommend). Currently reading Common Stocks and Uncommon Profits, a classic.
Buffett’s annual letter to shareholders is an inspiration for this letter. Here’s his 2023 letter, with a nice tribute to Charlie Munger. Two notable quotes:
Though the stock market is massively larger than it was in our early years, today’s active participants are neither more emotionally stable nor better taught than when I was in school. For whatever reasons, markets now exhibit far more casino-like behavior than they did when I was young. The casino now resides in many homes and daily tempts the occupants.
I believe Berkshire can handle financial disasters of a magnitude beyond any heretofore experienced. This ability is one we will not relinquish. When economic upsets occur, as they will, Berkshire’s goal will be to function as an asset to the country – just as it was in a very minor way in 2008-9 – and to help extinguish the financial fire rather than to be among the many companies that, inadvertently or otherwise, ignited the conflagration.
I have a lot to say this month about selling, theory, buying, and my sheet.
Sold
Last month I justified selling a few redundant ETFs, and that broke the seal. This month I sold 16 positions!
This is a little uncomfortable!
I think holding is the real power of investing. Stocks are like quantum waves - you can’t predict both how and when they’ll move. You might be right that a stock will go up or down, but it might take days or weeks or years. As John Maynard Keynes apparently said, the market can stay irrational longer than you can stay solvent. I try to ignore the daily/weekly/monthly gyrations of the market (he said in his monthly stock email) and focus on the macro trends.
If you imagine all the gains that a stock experienced in a year, I think it’s common for most of those gains to happen on just a few days, say a dozen. I don’t want to try to predict when those days will be, I want to be there for all of them - like the S&P 500 is. It’s risky to move your money around.
The power of holding is central to a lot of value investing advice, and yet I think even the most experienced investors can sell too much! I think they can’t help it, and they manage too much money, and they’d admit it themselves. It’s a sort of do-as-I-say-not-as-I-do. And it also feels good to sell because then you can buy, and buying feels great. That’s dangerous!
I’m willing to overcorrect, to be an investor that over-holds rather than over-sells. One reason I held onto some of my bankruptcies as long as I did was to experience over-holding, and I hadn’t developed a selling philosophy yet.
BUT, I sold 16 positions this month, encouraged by the books. I mostly sold stocks I bought in 2022 that don’t pass my modern analysis. Retail (especially clothing) that I don’t understand. Apps that don’t make money yet. An outdated theme park. I probably thought FIS was a bank when I bought it, but that was more money than I wanted on fintech. I’m shocked I made it out of FLWS alive, why did I put $150 on flower delivery?
Still, I mourn the loss of each position! Each was a seed that I was excited to watch, and now I’ve killed it. Hopefully this keeps my sell bar high, I want to hold. My preference to selling is to just dilute those positions by putting money elsewhere.
I’ve sold $2,491 worth of stock ($920 were the ETFS) which is 9.34% of how much I’ve invested. I’m glad that’s under 10%, and hopefully it’ll trend down.
I thought about selling my car stocks, TM GM BMWYY STLA F. Apparently car companies are cyclical, and I don’t think I want to be in cyclicals. They go up and down based on sales and market swings, but might go sideways over time. Maybe airlines and steel are cyclical. In theory you can buy the dip, then sell at the top, but that’s not why I’m here. (I’m not surprised car companies are desperate for subscribers, because subscription services usually aren’t cyclical.)
I still may sell my cars, but I decided to hold for now. The theory is that on a 30yr timeline they will go up on average, even if they snake up-and-down in cycles, on the back of technological progress. That’s what’s got me curious about airlines as well. I don’t imagine the demand for flights will evaporate in 30yrs, and I pray that airport security will improve dramatically.
These are the positions I sold this month. I feel like a dirty day trader, hopefully you can forgive me.
| sold | $gain | %gain | tkr | %div | description | cat | area | type | ? |
|---|---|---|---|---|---|---|---|---|---|
| $245 | $(19) | -7% | FIS | 2.1% | FIDELITY NA | finance | USA | tech | sold |
| $202 | $25 | 14% | SIX | 0.0% | SIX FLAGS E | travel | USA | park | sold |
| $154 | $(1) | -1% | BTI | 4.9% | BRITISH AME | retail | Europe | sin | sold |
| $153 | $1 | 0% | FLWS | 0.0% | 1 800 FLOWE | retail | USA | gifts | sold |
| $131 | $(5) | -3% | KSS | 9.9% | KOHLS CORP | retail | USA | sold | |
| $120 | $63 | 112% | PVH | 0.4% | PVH CORPORA | retail | USA | clothes | sold |
| $117 | $(114) | -49% | HBI | 1.9% | HANESBRANDS | retail | USA | clothes | sold |
| $96 | $9 | 9% | JWN | 6.1% | NORDSTROM I | retail | USA | clothes | sold |
| $85 | $42 | 94% | PKX | 4.8% | POSCO HOLDI | industry | Asia | steel | sold |
| $85 | $11 | 15% | EB | 0.0% | EVENTBRITE | tech | USA | app | sold |
| $80 | $(4) | -5% | RDFN | 0.0% | REDFIN CORP | tech | USA | app | sold |
| $47 | $(30) | -36% | VFC | 5.5% | V F CORP CO | retail | USA | clothes | sold |
| $31 | $(16) | -35% | KIRK | 0.0% | KIRKLANDS I | retail | USA | home | sold |
| $19 | $(24) | -55% | ILPT | 0.7% | INDUSTRIAL | industry | USA | office | sold |
| $5 | $(5) | -51% | NYCB | 3.8% | NEW YORK CO | finance | USA | bank | sold |
| $2 | $(240) | -99% | SBNY | 0.3% | SIGNATURE B | finance | USA | bank | sold |
I’m -$421 total in all my sold positions, so far.
Leveling Up
Let’s say you’ve decided to be like me, and you want to hold. How do you find stocks to hold?
I would say I’ve noticed three investing levels that describe my journey.
Level 1 is buying undervalued stocks and selling them when they’re overvalued, but you always keep your money in the market somewhere. Peter Lynch did this, aka “cigar butt” investing: pick an old cigar butt off the sidewalk and get one more puff. It’s difficult to find these hidden gems as the popularity and analysis of the market increases. (Level 0 would be to buy when a stock is undervalued, sell when it’s overvalued, and otherwise hold cash. This is what I did on Robinhood in 2020, basically.)
Level 2 investing is to buy an undervalued company that you can hold for decades. This is basically the best possible outcome, and so far META follows this story for me. I’m happy to own META for decades, but because I picked it up at a discount now I have an oversized position in a good company. My gains are compounding - now a 1% increase in META’s price is about a 3% (math?) increase in my META position’s total return. Sometimes you just get an oversized position in an average company, but ideally you get an oversized position in an outperforming company.
This is why it’s critical that you’re in a position to take advantage of market downturns (said the unemployed guy). At a time when other people are pessimistic and forced to sell out, you should be loading up on the best companies. Outsized positions in compounding machines is the best outcome. (I’ve been watching Joseph Carlson’s videos on compounding machines. I don’t agree with everything he says, but I’ve learned a lot here.)
But we can’t always be this lucky, which brings us to Level 3 investing: buy companies that will outperform the market for decades, at a fair price - maybe even a price that others consider “overvalued” at the moment. You’re buying because you believe in these companies for decades to come, after we forget about today’s valuation. Ignore the daily drama and focus on the merits of the company. Is this where MSFT is today? What about NVDA? The risk of course is that the company is actually substantially overvalued, or even worse it actually is a bubble! So we still need to watch out for ridiculous valuations. I’d like to think I would have known the 2000 valuations were ridiculous, but prices always look different in hindsight.
Level 3 is pragmatic, where Level 2 is opportunistic. Finding Level 2’s is great, but if you can’t find an undervalued company you like at the moment it’s still worth having your money on the market somewhere. Only chasing undervalued companies might hurt long-term returns, because not every market has the same opportunities. It’s dangerous when the market goes up, because then everybody is talking about their Level 2 victories and big returns, and you want to do the same. You could be chasing last year’s Level 2’s at the expense of this year’s Level 3’s. You’ll think you’re not going to be a sucker buying Microsoft at the top, you’re going to find the next NVDA! Then after five years in a bull market you’ve chased risk while Costco steadily outperformed, and then you quit investing before the next bear market (or even worse, during).
We just had two affordable opportunities to buy: the 2020 dip, and the 2022 bear market. In 2020 I doubled $10k and then sold out (thanks TSLA) and in 2022 I picked up good companies at a good price. And still, I feel regret, I could have done better! Down markets are great buying opportunities, but they’re difficult to analyze while they’re happening. I managed to ignore the fear and make a profit, and yet I feared too much - I bought risky “undervalued” bankruptcies when stable deals were available. I’m glad I could learn from this early in my journey, for the next bear market.
I find that the best investing advice takes time to understand. I think there are lessons that sound good on paper, but evolve in meaning as you gain experience. I’ve heard Buffett and others say you want to buy good companies without trying to time the market or their valuation, but those words mean more to me now than when I first heard them. I still need to invest $1k/mo, so I’m beginning to embrace Level 3.
Buys
I invested $2614 in 105 stocks this month, bolstered by the extra cash I had from selling. I found some interesting positions I wanted to start, especially through Chuck Akre’s holdings (referenced by Joseph Carlton). They like to hold concentrated positions for a long time, so I’m piggybacking off their research.
You could say I am diversified. If the S&P can have 500 stocks, why can’t I? I like to mix-and-match the best elements of different profiles, but my goal is to use bet sizing to concentrate where I have the most confidence - something I picked up from poker. I like putting $10 on a stock I’m just curious about, and then slowly build that position up to my level of confidence. Sometimes I get a position to say $100 and stop, because I haven’t done the research to justify more. I like to learn through experience.
I think of investing in $10 chips, so each month I deposit 100 chips to spend. I didn’t start this way, but I think a lot of my 2022 mistakes were in bet sizing more than stock choice. I wouldn’t be afraid to gamble $10-$50 on SBNY these days, but $240? No. I prefer this slow-and-steady process. Over time my money will naturally pool where I have the most confidence. I’ve got my spreadsheet working full steam ahead now (shown below) which helped me embrace the 100-chip mindset, I can really plan ahead and think about my spread. Hence, 106 buys this month.
I still want to be more concentrated over time, but things are going to get messy first as I shift to a Level 3 mindset. I’m excited for the year ahead though, there are positions I’m eager to build up, and I think we’ll get this portfolio into better shape.
Some of this month’s buys are Level 2 thinking, like another nibble on airlines. I bought a sizable stake of Tesla TSLA after a big dip, I’d been waiting a while. Then I read about cyclicals, and now I understand why Tesla’s future is uncertain - are they just another cyclical car company, or are they a growing tech company? Is full-self-driving the key? I haven’t decided if I want more.
I’m still buying into China. They’ve been in a recession, so I’m hoping for some nice Level 2 wins. Reddit would say the risk is that you can’t trust Chinese company metrics, but I imagine there’s a lot written on the Chinese internet about how you can’t trust America. I’m optimistic about China, because as an investor I’m optimistic about humans. I picked companies that look stable long-term, but may be caught up in China pessimism. I like companies with cash on hand, they should be able to survive a recession. I’m not in a hurry to get into China, I’m content to slowly trawl the bottom of their market.
At Level 3, I did put extra funds into big tech this month: AAPL, GOOG, AMZN, MSFT, also Berkshire Hathaway BRK.B. Recency bias has people thinking about the recession we just had, the Covid recession, China’s recession, crypto, VR, copyright battles, an election year after an insurrection, we’re not on mars, we don’t have self-driving cars, streaming has ads now, increasing wealth inequality, Magic cards are too long, Battlerite died. People are skeptical of the high prices for big tech, and they’re skeptical of another tech bubble and the AI bubble. NVDA especially looks overvalued, a harbinger of the crash to come.
As I embrace Level 3, and look beyond the valuation of the day, I see more decades of growth for these companies.
My sheet revealed an important metric: how the size of my positions compare to those stocks on the S&P 500. For example, META is about 8% of my account, but it’s only about 3% of the S&P 500. When I talk about beating the market, I am betting on META by about 2.8 times the market weight. Great! But when I look at GOOG, AAPL, MSFT, AMZN, despite them all being in my top 6 positions, I’m actually betting against each of them by about half! When I saw that, I realized I’d made a sizable error. It’s easy to miss this error in other people’s profiles, too - they may own these companies while actually betting against them vs the market. I’m eager to bet in favor of these companies.
I did buy more NVDA, but just a little. Rather than completely avoiding companies that seem overvalued, at times I may make small bets. You saw me do this with TSLA, start with a small bite and then buy more when the value looks better.
I also bought a spread of other semiconductor companies. I just looked into the category and picked the largest ones that looked reasonable. I think the demand for compute is just going up, and I expect the industry to absorb overflow demand from NVDA. Hopefully they’ll pop off eventually, and for now I can slowly trawl them. A great example of this strategy working for me is Taiwan Semiconductors TSM. I slowly bought in, $380 over five months, until it went up 30% in December. Now it’s my 8th largest holding.
I’m also excited to build positions in strong financial companies that look like compounding machines, pulled from Joseph Carlton’s holdings: Visa V, Mastercard M, Moody’s MCO, FICO, S&P Global SPGI. I thought SPGI was an EFT the first few times I saw it, turn out it’s a company. Also Costco COST is one I wish I was in sooner, but I’m slowly buying in now. Similarly, there are some food companies I like long-term. Joseph likes Chipotle CMG, and Texas Roadhouse TXRH. I’m also a fan of some Starbucks SBUX, McDonalds MCD, Pepsi PEP, Coca Cola KO.
In particular, I think Cisco CSCO looks promising. This is one where I’m just following the stats. Sometimes you look at a company’s numbers, and it seems clear that they’re at least trying to tell the story of a good business. Their revenue and earnings are stable, even through 2020. Dividends are slowly and steadily increasing. They have 23B cash on hand, and only 8B in debt, steadily down from 40B in 2018. And they’re doing share buybacks, their shares outstanding have steadily decreased. That’s all great! Their price has basically moved sideways since 2018 (their PE ratio is reasonable) but I see a deliberate progression since then, of reducing debt and building cash. So what’s next? I don’t know, and should do more research - a real financial analyst would visit their headquarters - but I have to imagine the stock price goes up from here regardless.
These are my buys this month, from most to least invested this month, with new positions bolded.
| buy | cost | value | $gain | %gain | tkr | description | acct% | cat | area | type |
|---|---|---|---|---|---|---|---|---|---|---|
| $150 | $840 | $952 | $117 | 14% | AAPL | APPLE INC | 3.1% | tech | USA | mag7 |
| $145 | $194 | $203 | $8 | 4% | TSLA | TESLA INC C | 0.7% | cars | USA | mag7 |
| $101 | $909 | $1,201 | $292 | 32% | GOOG | ALPHABET IN | 3.9% | tech | USA | mag7 |
| $98 | $585 | $731 | $146 | 25% | AMZN | AMAZON.COM | 2.4% | tech | USA | mag7 |
| $97 | $386 | $427 | $42 | 11% | BRK.B | BERKSHIRE H | 1.4% | multi | USA | |
| $81 | $654 | $914 | $263 | 40% | MSFT | MICROSOFT C | 3.0% | tech | USA | mag7 |
| $60 | $60 | $61 | $1 | 2% | MCO | MOODYS CORP | 0.2% | finance | USA | rate |
| $60 | $60 | $60 | $0 | 1% | SPGI | S&P GLOBAL | 0.2% | finance | USA | analyze |
| $59 | $59 | $62 | $3 | 4% | MA | MASTERCARD | 0.2% | finance | USA | credit |
| $55 | $55 | $57 | $2 | 3% | V | VISA INC | 0.2% | finance | USA | credit |
| $50 | $148 | $145 | $(3) | -2% | CSCO | CISCO SYSTE | 0.5% | coms | USA | |
| $48 | $205 | $222 | $19 | 9% | TXN | TEXAS INSTR | 0.7% | tech | USA | sc’s |
| $45 | $45 | $50 | $5 | 11% | BYDDY | BYD CO UNSP | 0.2% | cars | China | |
| $43 | $234 | $222 | $(10) | -4% | UPS | UNITED PARC | 0.7% | industry | USA | post |
| $39 | $39 | $37 | $(2) | -6% | DE | DEERE & CO | 0.1% | industry | USA | farm |
| $39 | $39 | $40 | $1 | 4% | CMG | CHIPOTLE ME | 0.1% | food | USA | retail |
| $38 | $264 | $218 | $(46) | -17% | PYPL | PAYPAL HLDG | 0.7% | finance | USA | tech |
| $38 | $38 | $37 | $(0) | -1% | SBUX | STARBUCKS C | 0.1% | food | USA | retail |
| $37 | $382 | $336 | $(43) | -11% | BABA | ALIBABA GRO | 1.1% | tech | China | retail |
| $36 | $36 | $37 | $2 | 4% | COST | COSTCO WHOL | 0.1% | retail | USA | value |
| $35 | $83 | $123 | $41 | 49% | NVDA | NVIDIA CORP | 0.4% | tech | USA | mag7 |
| $35 | $342 | $317 | $(14) | -4% | TCEHY | TENCENT HOL | 1.0% | tech | China | games |
| $34 | $34 | $35 | $0 | 1% | MCD | MCDONALD S | 0.1% | food | USA | retail |
| $34 | $212 | $176 | $(37) | -17% | CHTR | CHARTER COM | 0.6% | coms | USA | |
| $32 | $112 | $113 | $1 | 1% | JNJ | JOHNSON &JO | 0.4% | health | USA | |
| $31 | $70 | $88 | $18 | 27% | AXP | AMERICAN EX | 0.3% | finance | USA | credit |
| $30 | $62 | $59 | $(3) | -4% | VICI | VICI PPTYS | 0.2% | travel | USA | vegas |
| $30 | $76 | $63 | $(12) | -16% | HUM | HUMANA INC | 0.2% | health | USA | insure |
| $29 | $98 | $103 | $6 | 6% | CVS | CVS HEALTH | 0.3% | retail | USA | health |
| $27 | $27 | $30 | $3 | 12% | DG | DOLLAR GEN | 0.1% | retail | USA | |
| $26 | $59 | $58 | $(1) | -2% | PEP | PEPSICO INC | 0.2% | food | USA | cola |
| $25 | $25 | $26 | $1 | 4% | DHR | DANAHER COR | 0.1% | industry | USA | health |
| $23 | $23 | $29 | $5 | 24% | ALB | ALBEMARLE C | 0.1% | industry | USA | lithium |
| $23 | $246 | $184 | $(62) | -25% | JD | JD.COM INC | 0.6% | tech | China | retail |
| $22 | $78 | $106 | $28 | 36% | STLA | STELLANTIS | 0.3% | cars | Europe | |
| $21 | $21 | $21 | $(0) | 0% | LMT | LOCKHEED MA | 0.1% | tech | USA | aero |
| $21 | $44 | $42 | $(3) | -6% | BIDU | BAIDU INC S | 0.1% | tech | China | search |
| $20 | $127 | $117 | $(9) | -7% | UNH | UNITEDHEALT | 0.4% | health | USA | insure |
| $20 | $20 | $22 | $3 | 13% | TXRH | TEXAS ROADH | 0.1% | food | USA | retail |
| $19 | $19 | $19 | $(1) | -3% | HSY | HERSHEY COM | 0.1% | food | USA | candy |
| $19 | $19 | $20 | $1 | 4% | INTU | INTUIT INC | 0.1% | tech | USA | sw |
| $19 | $19 | $19 | $0 | 1% | FICO | FAIR ISAAC | 0.1% | tech | USA | analyze |
| $18 | $80 | $77 | $(2) | -2% | KO | COCA-COLA C | 0.3% | food | USA | cola |
| $18 | $18 | $19 | $1 | 7% | STM | STMICROELEC | 0.1% | tech | Europe | sc’s |
| $18 | $37 | $43 | $6 | 16% | YUMC | YUM CHINA H | 0.1% | food | China | |
| $16 | $16 | $17 | $1 | 7% | CAT | CATERPILLAR | 0.1% | industry | USA | farm |
| $16 | $91 | $95 | $5 | 6% | PG | PROCTER AND | 0.3% | retail | USA | health |
| $16 | $23 | $23 | $0 | 0% | UMC | UNITED MICR | 0.1% | tech | Asia | sc’s |
| $15 | $66 | $85 | $19 | 28% | LUV | SOUTHWEST A | 0.3% | travel | USA | air |
| $15 | $82 | $94 | $12 | 15% | AAL | AMERICAN AI | 0.3% | travel | USA | air |
| $15 | $15 | $16 | $1 | 9% | ON | ON SEMICOND | 0.1% | tech | USA | sc’s |
| $15 | $78 | $95 | $17 | 22% | KMX | CARMAX INC | 0.3% | cars | USA | used |
| $15 | $15 | $14 | $(1) | -5% | UTMD | UTAH MEDICA | 0.0% | health | USA | devices |
| $14 | $14 | $14 | $0 | 1% | VLO | VALERO ENER | 0.0% | energy | USA | oil |
| $14 | $14 | $15 | $1 | 5% | GMAB | GENMAB AS S | 0.0% | health | Europe | biotech |
| $13 | $13 | $15 | $2 | 15% | FANUY | FANUC CORPO | 0.0% | tech | Asia | robo |
| $13 | $46 | $45 | $(1) | -2% | GIS | GENERAL MIL | 0.1% | food | USA | |
| $13 | $13 | $13 | $(0) | 0% | PDD | PDD HOLDING | 0.0% | tech | China | retail |
| $12 | $12 | $13 | $1 | 8% | SCHW | SCHWAB CHAR | 0.0% | finance | USA | bank |
| $12 | $129 | $126 | $(3) | -3% | ADBE | ADOBE INC C | 0.4% | tech | USA | app |
| $12 | $12 | $14 | $2 | 13% | AVGO | BROADCOM IN | 0.0% | tech | USA | sc’s |
| $12 | $12 | $13 | $0 | 3% | UNP | UNION PAC C | 0.0% | travel | USA | rail |
| $12 | $12 | $12 | $0 | 2% | FDX | FEDEX CORP | 0.0% | industry | USA | post |
| $12 | $12 | $12 | $0 | 4% | NVO | NOVO NORDIS | 0.0% | health | Europe | pharm |
| $12 | $12 | $12 | $0 | 4% | WMT | WALMART INC | 0.0% | retail | USA | |
| $12 | $12 | $12 | $0 | 1% | GS | GOLDMAN SAC | 0.0% | finance | USA | bank |
| $12 | $927 | $933 | $15 | 2% | OXY | OCCIDENTAL | 3.0% | energy | USA | oil |
| $11 | $119 | $322 | $204 | 172% | NFLX | NETFLIX INC | 1.1% | media | USA | |
| $11 | $11 | $11 | $0 | 0% | ORCL | ORACLE CORP | 0.0% | tech | USA | corp |
| $11 | $29 | $39 | $9 | 32% | JBLU | JETBLUE AWY | 0.1% | travel | USA | air |
| $11 | $11 | $11 | $(0) | -2% | HDB | HDFC BANK L | 0.0% | finance | Asia | bank |
| $11 | $11 | $12 | $0 | 4% | TMO | THERMO FISH | 0.0% | health | USA | tech |
| $11 | $11 | $12 | $1 | 12% | LOW | LOWES COMPA | 0.0% | retail | USA | home |
| $11 | $46 | $48 | $2 | 4% | ALK | ALASKA AIR | 0.2% | travel | USA | air |
| $11 | $11 | $12 | $1 | 7% | HD | HOME DEPOT | 0.0% | retail | USA | home |
| $11 | $11 | $11 | $0 | 2% | ROP | ROPER TECHN | 0.0% | tech | USA | science |
| $11 | $11 | $12 | $2 | 15% | AMD | ADVANCED MI | 0.0% | tech | USA | sc’s |
| $11 | $11 | $10 | $(0) | -1% | SBAC | SBA COMMUNI | 0.0% | coms | USA | reit |
| $10 | $41 | $35 | $(3) | -7% | EQNR | EQUINOR ASA | 0.1% | energy | Europe | oil |
| $10 | $10 | $11 | $0 | 2% | SWKS | SKYWORKS SO | 0.0% | tech | USA | sc’s |
| $10 | $10 | $10 | $0 | 0% | MS | MORGAN STAN | 0.0% | finance | USA | bank |
| $10 | $10 | $11 | $1 | 6% | ORLY | OREILLY AUT | 0.0% | cars | USA | parts |
| $10 | $41 | $41 | $(0) | -1% | NKE | NIKE INC CL | 0.1% | retail | USA | clothes |
| $10 | $10 | $11 | $1 | 10% | NTES | NETEASE INC | 0.0% | tech | China | games |
| $10 | $10 | $10 | $(0) | 0% | ELV | ELEVANCE HE | 0.0% | health | USA | insure |
| $10 | $34 | $44 | $9 | 27% | CROX | CROCS INC | 0.1% | retail | USA | clothes |
| $10 | $10 | $10 | $0 | 1% | CI | THE CIGNA G | 0.0% | health | USA | insure |
| $10 | $10 | $10 | $0 | 5% | BAM | BROOKFIELD | 0.0% | finance | USA | invest |
| $10 | $10 | $10 | $0 | 5% | BN | BROOKFIELD | 0.0% | finance | America | invest |
| $10 | $10 | $9 | $(1) | -6% | DBRG | DIGITALBRID | 0.0% | finance | USA | land |
| $9 | $172 | $146 | $(27) | -16% | BNTX | BIONTECH SE | 0.5% | health | Europe | |
| $9 | $9 | $10 | $0 | 5% | KKR | KKR &CO INC | 0.0% | finance | USA | invest |
| $9 | $9 | $10 | $1 | 7% | AMT | AMERICAN TO | 0.0% | coms | USA | reit |
| $9 | $64 | $68 | $5 | 7% | BACHY | BANK OF CHI | 0.2% | finance | China | bank |
| $9 | $9 | $10 | $1 | 6% | ADI | ANALOG DEVI | 0.0% | tech | USA | sc’s |
| $9 | $208 | $110 | $(89) | -43% | WB | WEIBO ADR R | 0.4% | tech | China | app |
| $9 | $70 | $62 | $(7) | -10% | SQM | SOCIEDAD QU | 0.2% | industry | America | lithium |
| $8 | $8 | $7 | $(1) | -11% | GSHD | GOOSEHEAD I | 0.0% | finance | USA | insure |
| $8 | $32 | $35 | $2 | 8% | CP | CANADIAN PA | 0.1% | travel | America | rail |
| $8 | $88 | $99 | $10 | 11% | UAL | UNITED AIRL | 0.3% | travel | USA | air |
| $8 | $8 | $9 | $1 | 8% | CSGP | COSTAR GROU | 0.0% | tech | USA | land |
| $8 | $117 | $135 | $18 | 16% | DAL | DELTA AIR L | 0.4% | travel | USA | air |
| $8 | $81 | $79 | $(1) | -2% | ALGT | ALLEGIANT T | 0.3% | travel | USA | air |
| $8 | $40 | $34 | $(6) | -14% | SEDG | SOLAREDGE T | 0.1% | energy | USA | solar |
| $7 | $35 | $19 | $(15) | -42% | SAVE | SPIRIT AIRL | 0.1% | travel | USA | air |
Sheet
I finally got my spreadsheet into shape. I used to import a snapshot of my holdings once a month, and basically start from scratch. I finally figured out how to import my transactions instead, which is easier to update. Then, using the GOOGLEFINANCE formula, I can deduce the current value of my holdings. I can also finally see my dividend gains by position.
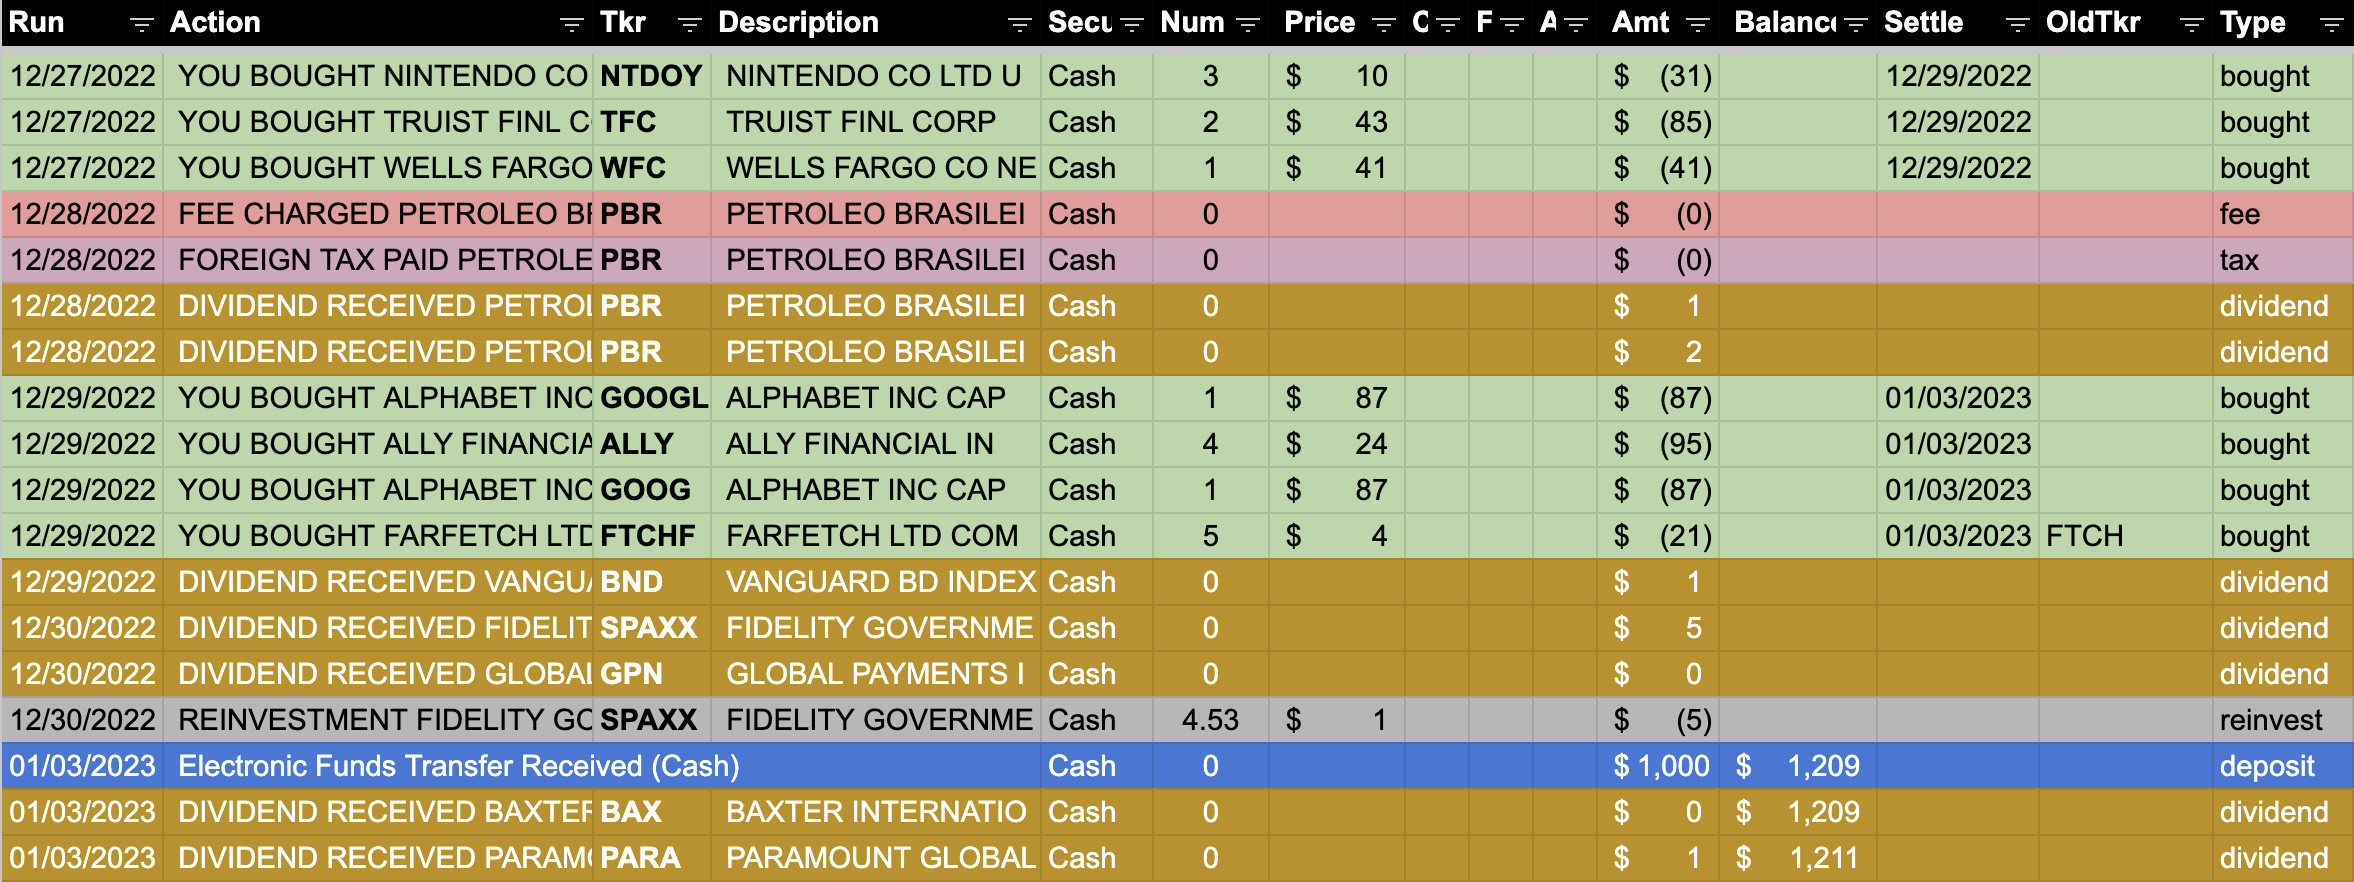
I did all this sheet work over the first two weeks of February, and I wrote the bulk of this email a couple weeks ago and have been waiting for today to export my sheet for you see. On Wednesday, my sheet stopped opening, I must have used too many formulas, I sheeted too close to the sun. I spent three hours yesterday at least getting an excel download of my google sheet, then I spent five hours rebuilding my sheet from scratch, but with less formulas. (GOOGLEFINANCE has some cool functions, but I mostly just use the ‘price’ lookup.)
They say not to own more positions than you can track and research, and they’re right. That’s why a spreadsheet like this is critical to me, now I can plan and execute my slow-spread strategy. There’s professional software I could use, like I use ThinkOrSwim from Fidelity, plus a handful of websites, but they’re mostly for stock analysis. What I really need is profile analysis and planning, and so far the sheet is the best solution I’ve found. I felt useless without my sheet, and I really wanted to share it with you, so I rebuilt it. I’d trained my whole life for that night.
The sheet mostly works, though there’s a 1% or so fudge range in all the data, especially after rebuilding it in a day. I’ve had to build in workarounds for GOOGLEFINANCE quirks and blind spots and fudge a couple things, and there’s probably an error in a formula somewhere. (Note that GOOG and GOOGL are combined.)
One of my favorite new metrics is a comparison between a position’s size in my account, and its size in the S&P 500, as I mentioned above. For example I have a 12x stake in General Motors GM, and a 0.7x stake in Berkshire Hathaway BRK.B. Now I can see that even though BRK.B is the larger position, I’m betting much more heavily on GM relative to the market.
I also improved my overview tab, to see helpful account stats. Let’s check that out before we get to my holdings.
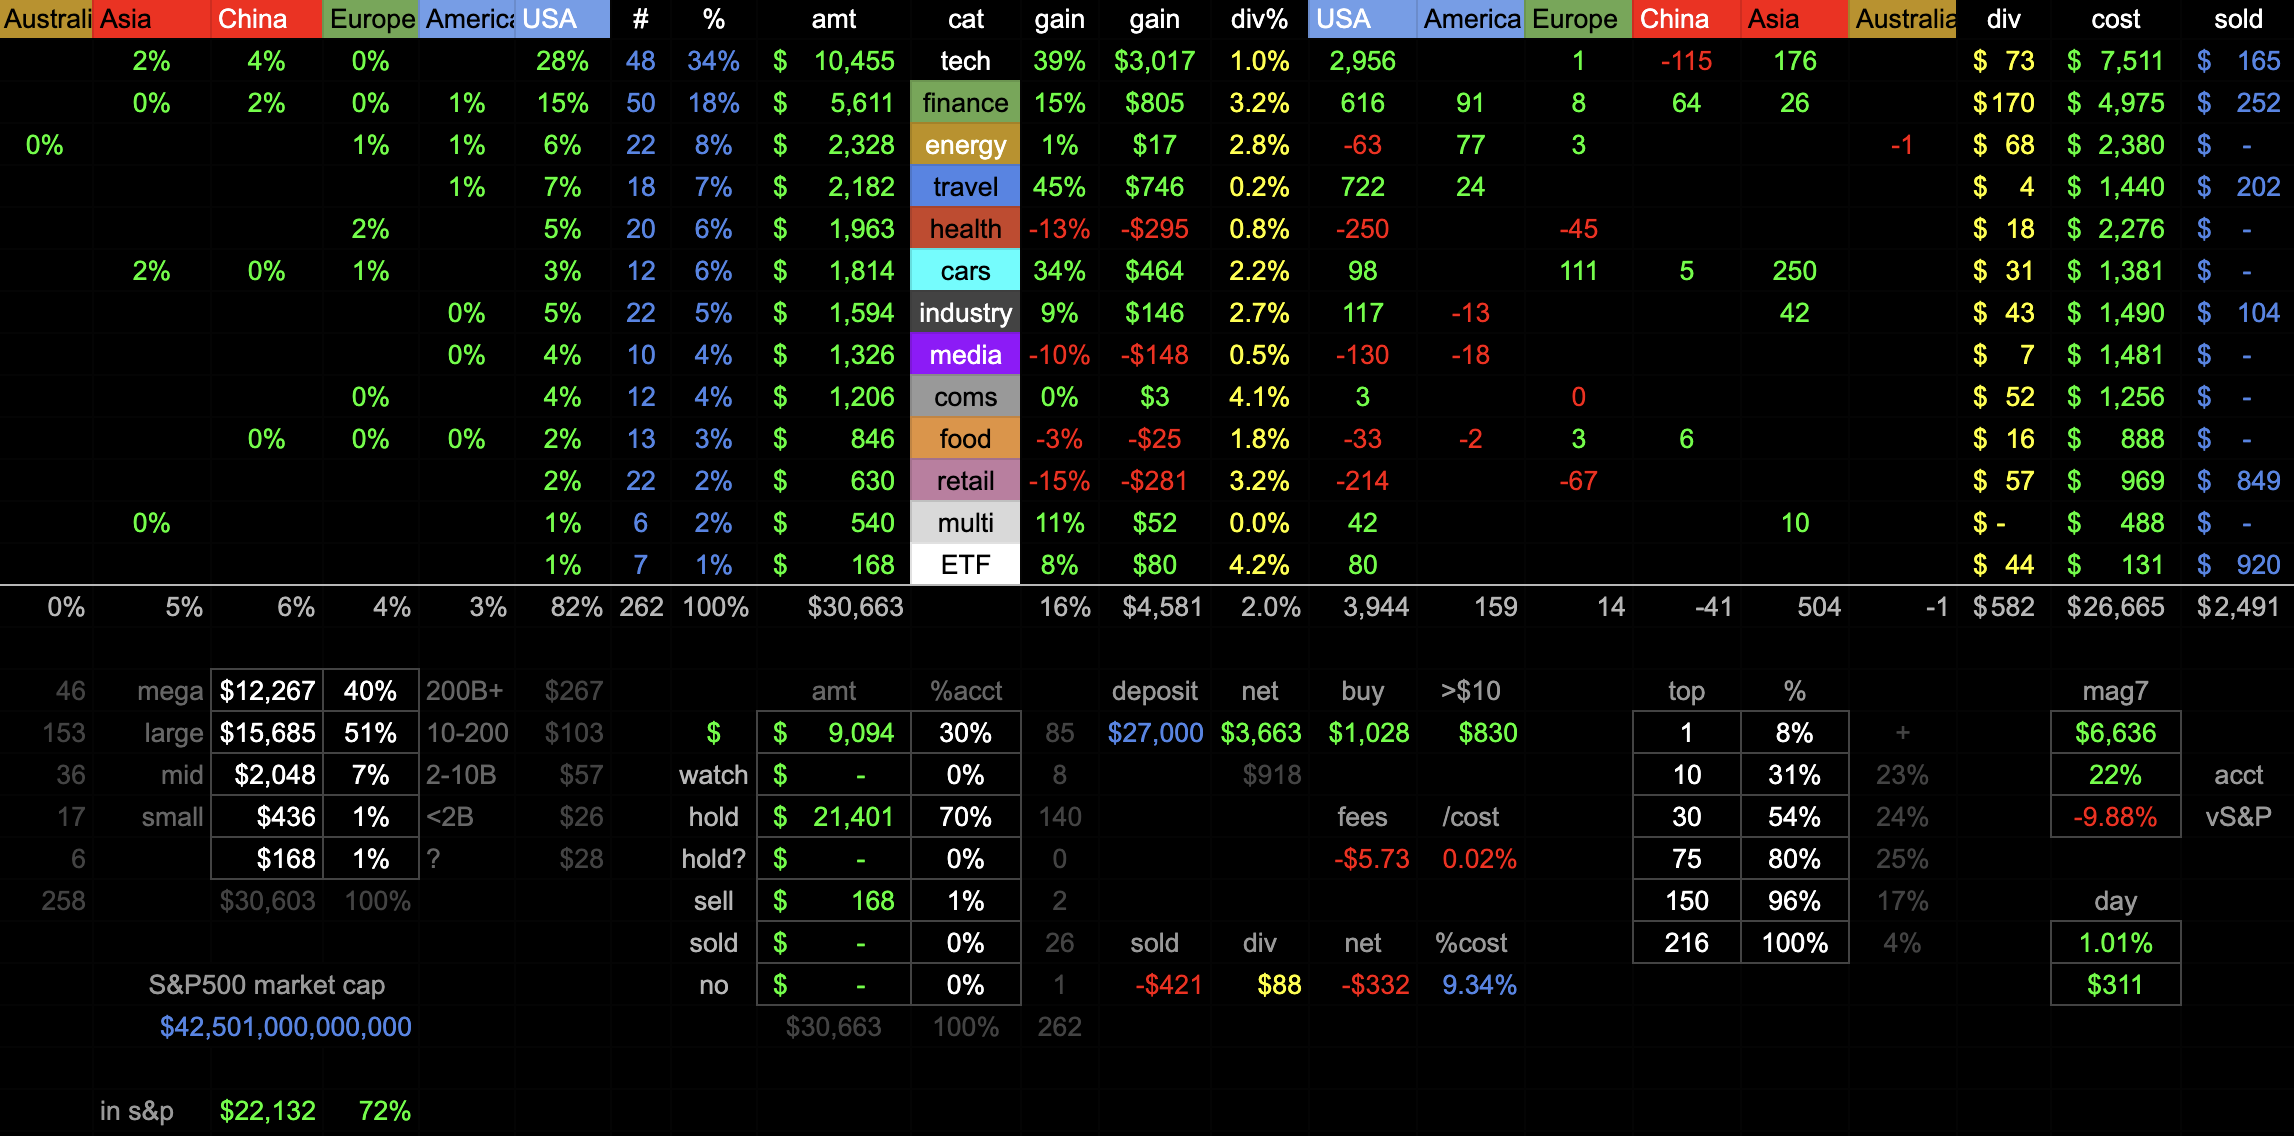
You can see the distribution of my account and gains by category and area of the world.
You can see that I have about 40% of my funds in ‘mega’ corporations greater than 200B in market cap, half of my holdings are large, and 7% are medium. And 72% of my holdings are in companies on the S&P 500, though on the right you can see that only 22% of my account is in the “magnificent 7”, compared to 32% of the S&P 500. And it looks like my account went up 1% today, or $311. (I’m taking these screenshots on March 1st.)
Currently I have 30% of my account (85 positions) marked that I want to buy next month, I’m watching 8 positions (of zero value, because I haven’t started them yet), 70% of my account (140 positions) I am currently happy to hold, and 2 positions ($166) I want to sell (ETFs that haven’t gone long yet). I’ve sold roughly 26 positions entirely.
I have a total of $1,317 earmarked for those 79 positions I want to buy. That’s more money than I deposit each month - I can’t pick all the $10 positions I’ve marked, but I will likely buy everything I have marked for more than one chip, totaling $830.
You can see my top 1 position (META) is 8% of my account, and my top 10 positions are 31% of my account (the top 9 is 23%). My top 30 positions are about half of my account, and top 75 are still only about 80%. I have 216 potions! I’d like to be more concentrated than this, but it will take time.
I made charts, which I will show you, but sadly I think the data for these charts is what caused the sheet to crash - I was tracking historical prices for every position back a few years - so I haven’t rebuilt them, yet. Screenshots from mid-February. Here are my dividends.
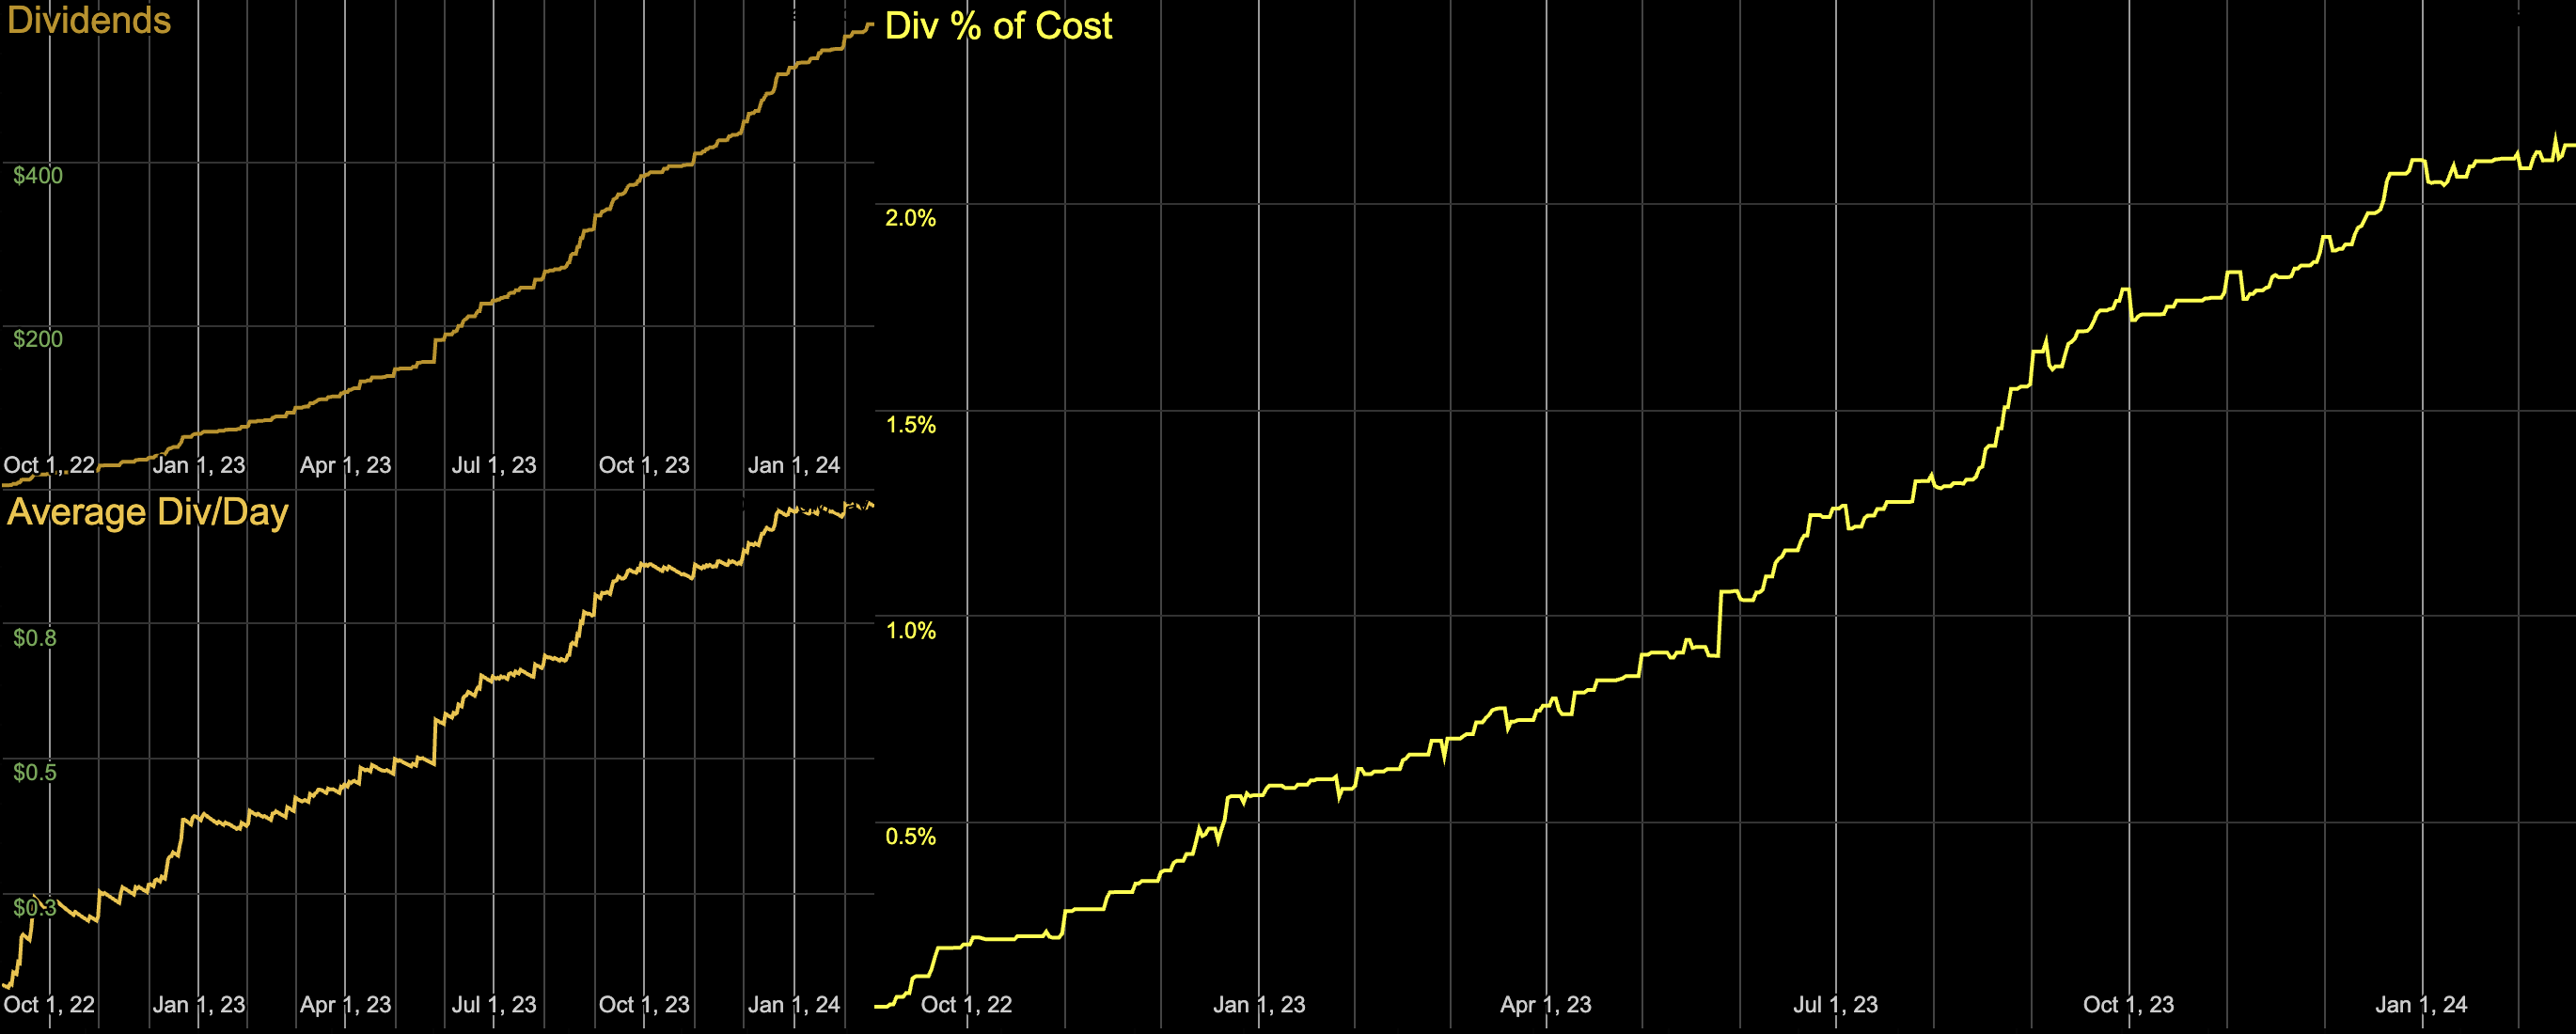
The total dividends should curve up, the average dividends should be pretty linear (unless I start prioritizing or deemphasizing dividend stocks in particular) and the dividend rate is flattening out around 2% of cost.
I could also see the rate I’ve added new positions.
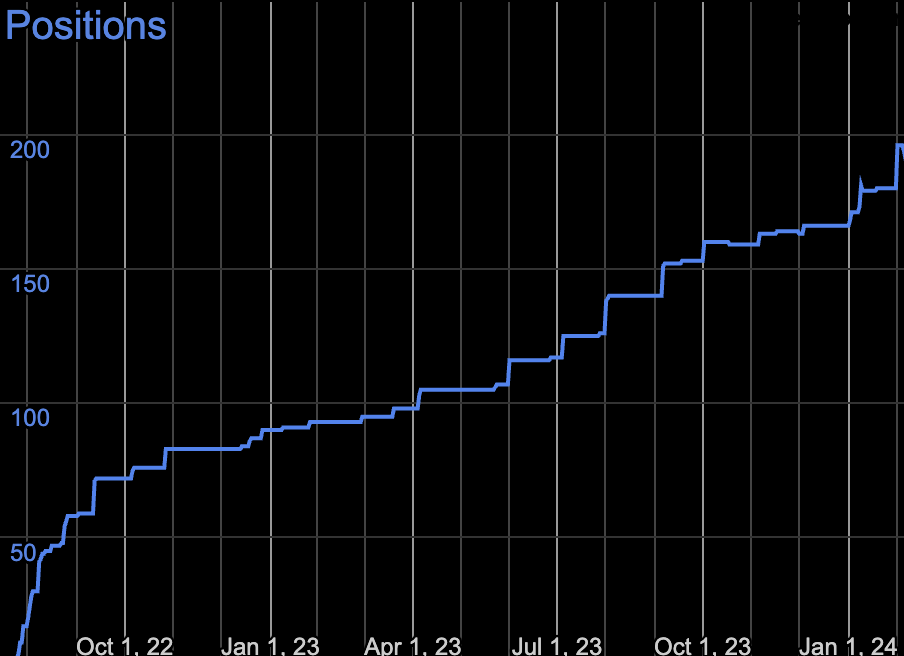
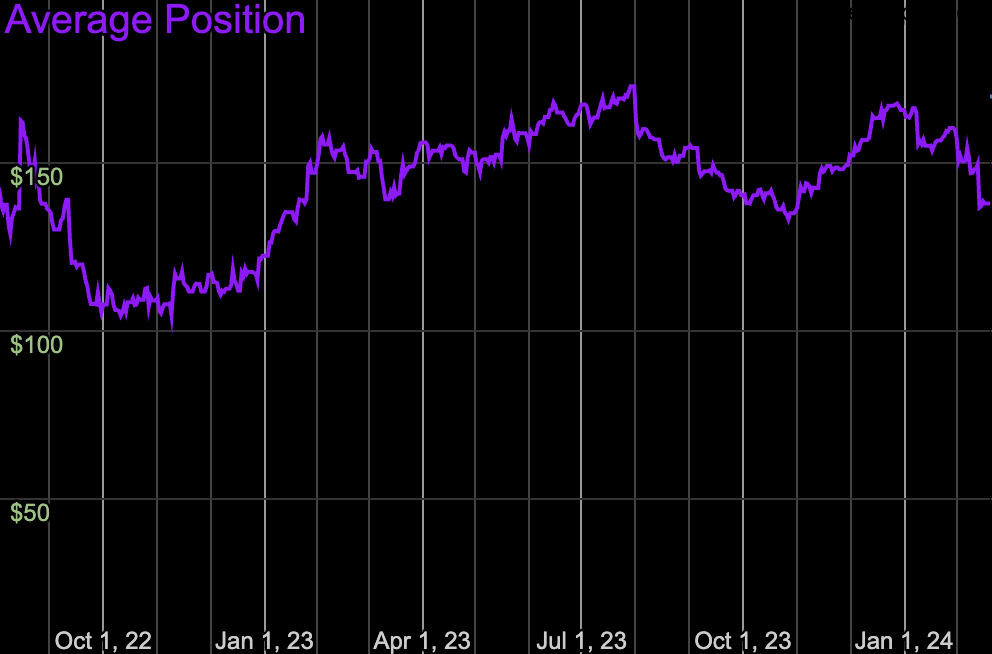
I can see my average position has been around $150. This looks consistent, but it means my account is being diluted over time as I add more positions. I’d like to see this number higher as I consolidate.
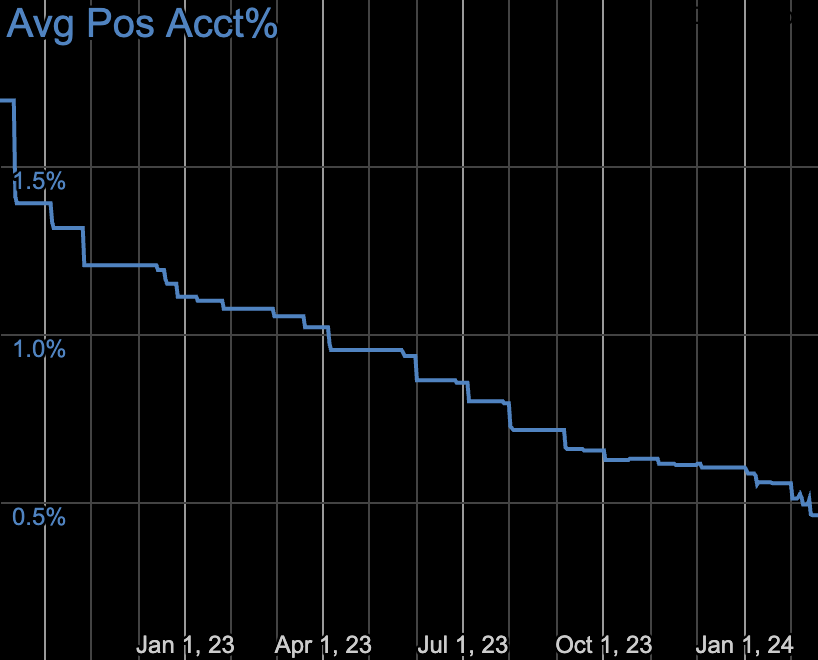
That dilution is easy to see here, where the average size of my positions relative to my account has fallen to about 0.5%. Hopefully this will level off this year, and then rise.
I love being able to visualize my goals! I’ll have to see which of these I can safely rebuild.
This brings us to my favorite chart - my performance against the S&P 500 since the day I started! I think this is what really killed my sheet, and I really had to noodle on it.

As you can see, I’m significantly behind, despite apparently beating the S&P 500 slightly in 2023. Although that margin is hard to see if you look at the quarterly performance - did I really beat the market even though I lost 3/4 quarters, and only beat the last quarter slightly? You can see where SBNY went bankrupt in March 2023, I definitely would have beat the market without that drop! It’s important to avoid bankruptcies.
I think that disconnect is coming from a time-weight vs money-weighted rate of return, though it certainly could be a result of error on my part as well. I believe the above charts are time-weighted, meaning it doesn’t matter when I deposited my money, it’s just comparing the raw percentage performance of the two funds. I think I came out ahead on a ‘money-weighted’ view, which accounts for the timing of my buys. I wish I could compare both views, but that’s a future project. It’d be great to compare my performance to if I’d just bought $1000 of SPY on the first of each month, that’s what I really want to beat.
I miss my graphs :(
Holdings
Finally, let’s talk about my holdings, and look at my sheet.
Typically I’ve shown my holdings as a markdown table (as above) but this month I attached PDFs of my holdings, exports from my sheet. Here are three attached PDF views: the THIN view will be the easiest to read, the the WIDE view view includes some of the metrics and data, and the the FULL view view will show you everything if you’re curious, including columns largely used for calculation. I’m going to describe the columns in the BIG view here.
The ‘#’ column is a position’s rank, from highest value to lowest value. (I wish I’d learned the RANK formula ten years ago! I’m still learning sheet tactics.)
Then you can see the earliest date I purchased the stock, and what percent of it is short - full pink means 100% short, black is 0% short. Then you can see how much I put into each position this month, the number of shares, the cost of a position, and its current value. You can also see the dollar and percent gain (or loss) for that position, which now includes dividends! Account for dividends took some positions from negative to positive, so I’m really glad I can see that now. Each position’s dividend rate (if it has one) is relative to the cost I paid. (I might change this to yearly dividend rate, eventually, but for now it’ll just accrue.)
The positions are colored based on the ‘?’ column, which is my status for that position. Dark positions are ones I’m happy to hold, and green positions are ones I intend to buy. This really helps me read my portfolio quickly. Then you can see a positions percentage of my account, and how that compares to that stock’s portion of the S&P 500. Then there’s the stock’s category, geographic area, and type. I enter these manually, and it’s not always clear, so there’s some room for debate. I also enter the year the stock was added to the S&P 500. (I just need to know if a stock is/isn’t on the S&P, but the year is more interesting than a y/n.)
Then there are stat columns: market cap (in billions), pe ratio (a high ratio means the stock price is high relative to earnings), earnings-per-share, the $change in my position on the last trading day as well as the week/month/year percentage changes for that stock price.
Conclusion
There you have it. I’d be happy to answer any questions or share my sheet, don’t be afraid to ask. This sheet is a reflection of my brain and how I think, it’s very me, and I spend a lot of time in there just sorting and filtering and scrolling and planning and thinking and questioning. Let me know how you like the PDFs compared to the markdown tables, I want to make sure these are readable to you.