Performance
| Fund | 1-month | 3-month | YTD | 1-year |
|---|---|---|---|---|
| My Fund | (-5.6%) | 9.4% | 18.4% | 7.6% |
| S&P 500 | (-1.6%) | 8.3% | 18.7% | 15.9% |
| Dow Jones | (-2.0%) | 8.5% | 18.1% | 14.8% |
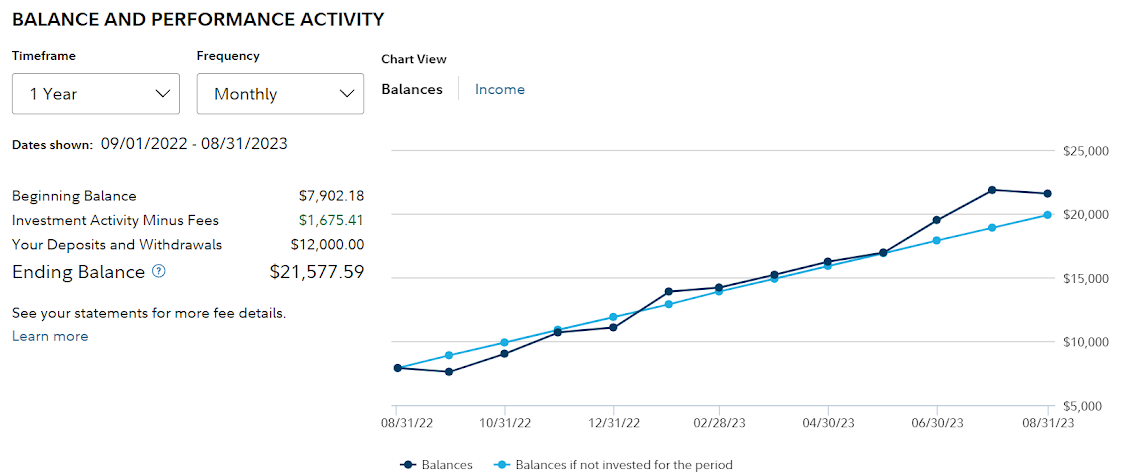
I like this graph, which shows my performance over time relative to my deposits, which are steadily climbing at $1k/mo. You can see I used to be down overall, and now I’m up overall, but less than last month for sure. Hopefully over time that dark line should dramatically beat the light one! (If I beat the market is another matter.)
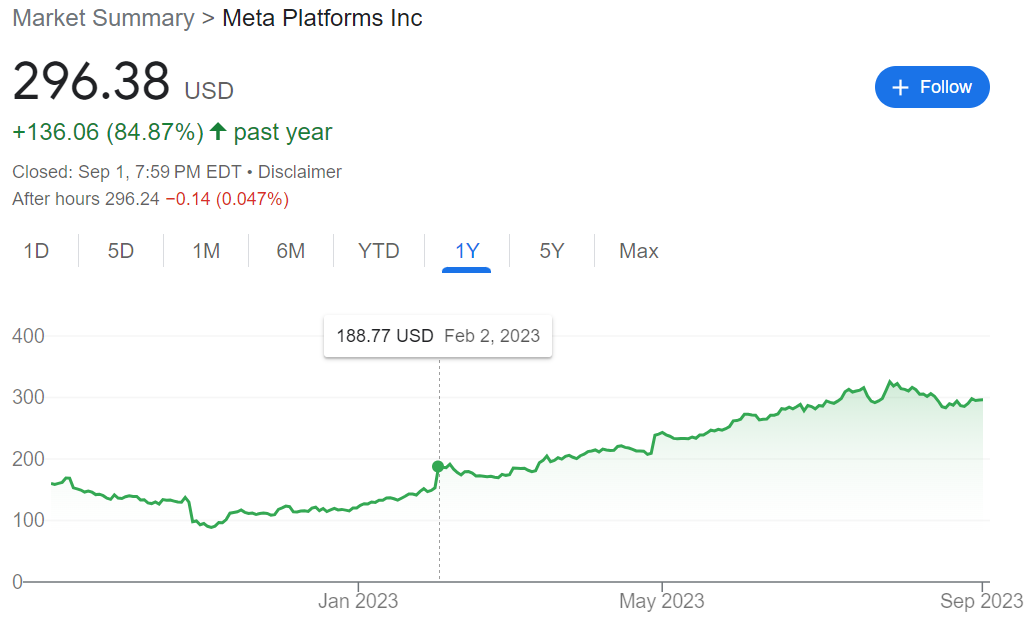
META still has a pretty strong influence on my overall performance right now, now at around 6.5% of my holdings. It dropped this month, and so did I. If you look at META over the last year, you can see some correlation to my overall performance. (SBNY went bankrupt in March, and BBBY went bankrupt in April.)
A Good Site
One of the sites I use most often when evaluating a stock is companiesmarketcap.com. I like the way they show historic data, which is useful for metrics that are more relative than definitive. (I think not all foreign stocks are available, and not all metrics are available for all stocks.) [Some metrics are behind a year, like earnings and revenue.]
You can search for a stock ticker, like HMST, one I was looking at when I started writing this section about a month ago, found in a blog post. These are the metrics I look at, and what you might look for in your own research.
- Market Cap: The blogger thinks HMST will get acquired, and says you should buy the dip. It sure did dip. (They were earlier than I was, so they probably profited here.)
- Revenue: I wish this was going up instead.
- Earnings: I also wish this was going up instead.
- PE Ratio: Remember, you want a low PE ratio - a high ratio means the stock is potentially overvalued, or at least earnings are expected to catch up to the price. I like that I can see the PE over time, so I can see the relative size, since typical PE ratios can vary by industry. This used to have a ratio of about 4PE, low compared to a history around 10PE, and low in general. However, my more robust app (ThinkOrSwim) shows a PE ratio of 70! So I found another source and sure enough it looks like the PE ratio just shot up recently - a mix of the increase in price and decrease in earnings.
- Total Debt: Another important metric to see over time. They’ve taken on debt recently (as have many companies) though their Long Term Debt to Capital ratio (which I can see in ThinkOrSwim) looks fine at 10, which means their debt isn’t so big relative to their capital. For comparison, American Airlines’ debt ratio is over 100! (To be fair, cruises also have a lot of debt, but I did well with buying the huge cruise dip. My theory was they can’t all go bankrupt…? Airlines too?)
- Cash On Hand: This is the newest metric I’ve started watching, after hearing some investors value it heavily - at least in this economy, with fear of a recession. I’m neutral on this graph, it’s pretty flat. I like to also look at the Price/FreeCashFlow ratio, which is like PE in that a high number means the stock is perhaps overvalued relative to its cash flow. Again looking in ThinkOrSwim, I see a ratio of 2.4, which is great.
Overall, this strikes me as an investor making a short-term play based on a corporate action, which isn’t really my jam, and I might have missed the window they profited on anyway. Maybe I’d buy if I was more familiar with the industry, but I decided not to buy it last month, and seeing its PE ratio climb this month is validating.
These metrics should give you a good overall picture when researching a stock. If this was the only site you used, and you browsed these metrics, I think you’re doing more research than most. And the more you do it, the more you get a feel for the different patterns and industries.
Buys
Note that this data includes the first day of September. I need to remember to download my data after the last trading day of the month, whoops. (I’m so sorry for the empty columns on the right! I didn’t notice until I was too deep in editing this to go back. Email in 2023.)
Maybe I should stop buying Chinese banks?
| Total | Symbol | Account % | Total % Gain | Total $ Gain | New Shares | Description | Old Shares | Average Price | Last Price | Notes |
|---|---|---|---|---|---|---|---|---|---|---|
| $465 | PFE | 2.05% | -8.5% | -$43 | 1 | PFIZER INC | 12 | $39 | $36 | my main healthcare pick |
| $279 | VZ** | 1.23% | -16.8% | -$56 | 1 | VERIZON COMMUNICATIONS IN | 7 | $42 | $35 | dip |
| $210 | TSN | 0.93% | -16.3% | -$41 | 1 | TYSON FOODS INC | 3 | $63 | $53 | congress trade |
| $176 | T | 0.78% | -17.4% | -$37 | 2 | AT&T INC COM USD1 | 10 | $18 | $15 | dip |
| $121 | ACGBY** | 0.53% | 4.9% | $6 | 2 | AGRICULTURAL BANK-UNSPON | 12 | $8 | $9 | chinese Big Four bank |
| $113 | FIS** | 0.50% | -28.8% | -$46 | 1 | FIDELITY NATL INFORMATION | 1 | $80 | $57 | bank dip, superinvestor Seth Klarman |
| $111 | IDCBY** | 0.49% | -9.2% | -$11 | 2 | INDUSTRIAL &COMMERCIAL BK | 10 | $10 | $9 | chinese Big Four bank |
| $108 | CICHY** | 0.48% | -12.7% | -$16 | 2 | CHINA CONSTRUCTION BANK C | 8 | $12 | $11 | chinese Big Four bank |
| $106 | SNY | 0.47% | -0.8% | -$1 | 1 | SANOFI ADR REP 1 1/2 ORD | 1 | $54 | $53 | healthcare pick to grow sector |
| $99 | BTI | 0.44% | -0.2% | $0 | 1 | BRITISH AMERICAN TOBACCO | 2 | $33 | $33 | more low-pe tobacco |
| $97 | LSXMA | 0.43% | 13.5% | $11 | 1 | LIBERTY MEDIA CORP DEL CO | 3 | $21 | $24 | i think this is also the result of a Liberty Media merger |
| $75 | SCHD* | 0.33% | 1.0% | $1 | 1 | SCHWAB US DIVIDEND EQUITY | 0 | $74 | $75 | dividends darling |
| $67 | NEE* | 0.30% | -8.8% | -$6 | 1 | NEXTERA ENERGY INC COM US | 0 | $73 | $67 | energy pick to build utilities sector |
| $65 | KHC | 0.29% | -9.5% | -$7 | 1 | KRAFT HEINZ CO COM | 1 | $36 | $33 | buffett has held this a long time |
| $63 | NGG* | 0.28% | -5.1% | -$3 | 1 | NATIONAL GRID SPON ADR EA | 0 | $66 | $63 | energy pick to build utilities sector |
| $63 | SHEL* | 0.28% | 2.6% | $2 | 1 | SHELL PLC SPON ADS EA REP | 0 | $61 | $63 | more low-PE oil |
| $62 | BMY* | 0.27% | -0.5% | $0 | 1 | BRISTOL-MYERS SQUIBB CO C | 0 | $62 | $62 | healthcare pick to build sector |
| $59 | KO* | 0.26% | -4.7% | -$3 | 1 | COCA-COLA CO | 0 | $62 | $59 | buffett has held this a long time I saw an opportunity to get in |
| $53 | BIIB* | 0.24% | -0.8% | $0 | 0.2 | BIOGEN INC COM USD0.0005 | 0 | $269 | $267 | biotech pick to build healthcare sector, has a good buffett score of 8 |
| $46 | HPK* | 0.20% | 0.7% | $0 | 3 | HIGHPEAK ENERGY INC COM | 0 | $15 | $15 | more low-PE oil, insider trading |
| $37 | RHHBY* | 0.16% | -4.6% | -$2 | 1 | ROCHE HOLDINGS ADR | 0 | $38 | $37 | healthcare pick to grow sector, superinvestor Dodge&Cox |
| $34 | LLYVA* | 0.15% | 10.3% | $3 | 1 | LIBERTY MEDIA CORP DEL CO | 0 | $31 | $34 | not exactly new, looks like this was granted as part of a Liberty Media merger |
| $32 | EQNR* | 0.14% | 3.9% | $1 | 1 | EQUINOR ASA SPON ADR EACH | 0 | $30 | $32 | energy pick to build sector |
| $29 | VSAT* | 0.13% | -5.9% | -$2 | 1 | VIASAT INC | 0 | $31 | $29 | superinvestor Seth Klarman |
| $28 | VALE* | 0.12% | -2.4% | -$1 | 2 | VALE S.A. SPONS ADS REPR | 0 | $14 | $14 | congress buy |
| $17 | BACHY* | 0.08% | -7.1% | -$1 | 2 | BANK OF CHINA LTD ADR | 0 | $9 | $9 | chinese Big Four bank |
*New Positions
**Now for sale long (bought in August 2022)
Holds
Again I’ve marked the stocks I bought a year ago, in August (and not the ones in July). Sorted by percent gain. It’s interesting to see the spread in my pick quality again - it’s a good thing I bought cruises! I’m going to keep holding - would you?
| Total | Symbol | Account % | Total % Gain | Total $ Gain | Description | Shares | Average Price | Last Price |
|---|---|---|---|---|---|---|---|---|
| $107 | PKX** | 0.5% | 139.0% | $62 | POSCO HOLDINGS INC ADR EA | 1 | $45 | $107 |
| $391 | RCL** | 1.7% | 138.2% | $227 | ROYAL CARIBBEAN GROUP COM | 4 | $41 | $98 |
| $220 | NFLX | 1.0% | 105.4% | $113 | NETFLIX INC | 0.5 | $214 | $440 |
| $1,482 | META | 6.5% | 85.2% | $682 | META PLATFORMS INC CLASS | 5 | $160 | $296 |
| $236 | CCL | 1.0% | 65.4% | $93 | CARNIVAL CORP COM USD0.01 | 15 | $10 | $16 |
| $212 | CUK** | 0.9% | 55.8% | $76 | CARNIVAL ADR REP 1 ORD | 15 | $9 | $14 |
| $229 | LNVGY | 1.0% | 53.8% | $80 | LENOVO GROUP ADR | 10 | $15 | $23 |
| $86 | NOV | 0.4% | 52.7% | $30 | NOV INC COM | 4 | $14 | $22 |
| $410 | GOOG | 1.8% | 52.5% | $141 | ALPHABET INC CAP STK CL C | 3 | $90 | $137 |
| $407 | GOOGL | 1.8% | 51.7% | $139 | ALPHABET INC CAP STK CL A | 3 | $89 | $136 |
| $110 | LVS | 0.5% | 47.2% | $35 | LAS VEGAS SANDS CORP COM | 2 | $37 | $55 |
| $84 | PVH | 0.4% | 47.2% | $27 | PVH CORPORATION COM | 1 | $57 | $84 |
| $144 | HPE | 0.6% | 42.0% | $43 | HEWLETT PACKARD ENTERPRIS | 8 | $13 | $18 |
| $103 | EB** | 0.5% | 39.2% | $29 | EVENTBRITE INC COM CL A | 10 | $7 | $10 |
| $125 | STNE | 0.6% | 37.5% | $34 | STONECO LTD COM USD0.0000 | 10 | $9 | $13 |
| $568 | AAPL | 2.5% | 34.9% | $147 | APPLE INC | 3 | $140 | $189 |
| $86 | OKTA | 0.4% | 32.8% | $21 | OKTA INC CL A | 1 | $65 | $86 |
| $329 | MSFT | 1.5% | 32.1% | $80 | MICROSOFT CORP | 1 | $249 | $329 |
| $84 | KMX | 0.4% | 31.8% | $20 | CARMAX INC | 1 | $63 | $84 |
| $246 | NCLH** | 1.1% | 31.2% | $58 | NORWEGIAN CRUISE LINE HLD | 15 | $13 | $16 |
| $170 | BMWYY** | 0.8% | 29.7% | $39 | BAYERISCHE MOTOREN WERKE | 5 | $26 | $34 |
| $65 | HMC | 0.3% | 29.1% | $15 | HONDA MOTOR LTD AMERN SHS | 2 | $25 | $32 |
| $135 | UHS** | 0.6% | 28.2% | $30 | UNIVERSAL HEALTH SERVICES | 1 | $105 | $135 |
| $345 | TM | 1.5% | 26.5% | $72 | TOYOTA MOTOR CORP ADR-EAC | 2 | $136 | $173 |
| $211 | MU | 0.9% | 26.4% | $44 | MICRON TECHNOLOGY INC | 3 | $56 | $70 |
| $74 | LSXMK | 0.3% | 24.7% | $15 | LIBERTY MEDIA CORP DEL CO | 3 | $20 | $25 |
| $101 | MKSI | 0.5% | 24.5% | $20 | MKS INSTRS INC COM | 1 | $81 | $101 |
| $137 | CMCSA** | 0.6% | 23.2% | $26 | COMCAST CORP | 3 | $37 | $46 |
| $16 | SHYF | 0.1% | 22.8% | $3 | SHYFT GROUP INC COM | 1 | $13 | $16 |
| $88 | LILAK** | 0.4% | 21.0% | $15 | LIBERTY LATIN AMERICA LTD | 10 | $7 | $9 |
| $294 | JPM** | 1.3% | 20.8% | $51 | JPMORGAN CHASE & CO | 2 | $122 | $147 |
| $167 | HOOD | 0.7% | 18.7% | $26 | ROBINHOOD MKTS INC COM CL | 15 | $9 | $11 |
| $145 | PBR | 0.6% | 18.6% | $23 | PETROLEO BRASILEIRO SA PE | 10 | $12 | $14 |
| $12 | NYCB | 0.1% | 18.5% | $2 | NEW YORK COMMUNITY BANCOR | 1 | $10 | $12 |
| $87 | LILA** | 0.4% | 18.3% | $14 | LIBERTY LATIN AMERICA LTD | 10 | $7 | $9 |
| $211 | CHTR | 0.9% | 18.2% | $32 | CHARTER COMMUNICATIONS IN | 0.5 | $357 | $422 |
| $114 | CTRA | 0.5% | 17.4% | $17 | COTERRA ENERGY INC COM | 4 | $24 | $28 |
| $258 | CE** | 1.1% | 16.8% | $37 | CELANESE CORP DEL COM | 2 | $110 | $129 |
| $86 | CDLX** | 0.4% | 15.8% | $12 | CARDLYTICS INC COM | 5 | $15 | $17 |
| $54 | QRVO | 0.2% | 15.2% | $7 | QORVO INC | 0.5 | $94 | $108 |
| $83 | AVUV | 0.4% | 15.0% | $11 | AMERICAN CENTY ETF TR AVA | 1 | $72 | $83 |
| $79 | CF | 0.4% | 13.5% | $9 | CF INDUSTRIES HOLDINGS IN | 1 | $70 | $79 |
| $122 | BNTX | 0.5% | 13.1% | $14 | BIONTECH SE SPON ADS EACH | 1 | $108 | $122 |
| $112 | VXUS | 0.5% | 12.2% | $12 | VANGUARD TOTAL INTERNATIO | 2 | $50 | $56 |
| $8 | PACW | 0.0% | 12.1% | $1 | PACWEST BANCORP DEL COM | 1 | $7 | $8 |
| $47 | CLF | 0.2% | 11.7% | $5 | CLEVELAND-CLIFFS INC NEW | 3 | $14 | $16 |
| $94 | RDFN** | 0.4% | 11.4% | $10 | REDFIN CORP COM | 10 | $8 | $9 |
| $85 | OMF | 0.4% | 11.3% | $9 | ONEMAIN HLDGS INC COM | 2 | $38 | $42 |
| $46 | VEA | 0.2% | 10.6% | $4 | VANGUARD DEVELOPED MARKET | 1 | $41 | $46 |
| $112 | VSS | 0.5% | 9.7% | $10 | VANGUARD INTL EQUITY INDE | 1 | $102 | $112 |
| $129 | GPN | 0.6% | 9.5% | $11 | GLOBAL PAYMENTS INC | 1 | $118 | $129 |
| $254 | TCEHY** | 1.1% | 9.4% | $22 | TENCENT HOLDINGS LIMITED | 6 | $39 | $42 |
| $65 | NTR | 0.3% | 8.3% | $5 | NUTRIEN LTD COM NPV ISIN | 1 | $60 | $65 |
| $190 | SIX** | 0.8% | 8.0% | $14 | SIX FLAGS ENTERTAINMENT C | 8 | $22 | $24 |
| $61 | F | 0.3% | 7.9% | $4 | FORD MTR CO DEL COM | 5 | $11 | $12 |
| $111 | DOW | 0.5% | 7.8% | $8 | DOW INC COM | 2 | $51 | $55 |
| $53 | DVN | 0.2% | 7.4% | $4 | DEVON ENERGY CORP NEW | 1 | $49 | $53 |
| $34 | HBAN | 0.2% | 7.4% | $2 | HUNTINGTON BANCSHARES INC | 3 | $10 | $11 |
| $243 | HPQ | 1.1% | 7.4% | $17 | HP INC COM | 8 | $28 | $30 |
| $904 | OXY** | 4.0% | 5.5% | $47 | OCCIDENTAL PETE CORP COM | 14 | $61 | $65 |
| $311 | COF | 1.4% | 5.5% | $16 | CAPITAL ONE FINANCIAL COR | 3 | $98 | $104 |
| $285 | BABA | 1.3% | 5.1% | $14 | ALIBABA GROUP HOLDING LTD | 3 | $90 | $95 |
| $366 | INTC | 1.6% | 5.1% | $18 | INTEL CORP COM USD0.001 | 10 | $35 | $37 |
| $493 | CVX | 2.2% | 5.0% | $24 | CHEVRON CORP NEW COM | 3 | $156 | $164 |
| $61 | TD | 0.3% | 4.4% | $3 | TORONTO DOMINION BANK ONT | 1 | $59 | $61 |
| $122 | PNC | 0.5% | 4.3% | $5 | PNC FINANCIAL SERVICES GR | 1 | $117 | $122 |
| $38 | BCS | 0.2% | 3.1% | $1 | BARCLAYS PLC ADR-EACH CV | 5 | $7 | $8 |
| $250 | WFC | 1.1% | 2.4% | $6 | WELLS FARGO CO NEW COM | 6 | $41 | $42 |
| $27 | FITB | 0.1% | 2.3% | $1 | FIFTH THIRD BANCORP | 1 | $26 | $27 |
| $9 | PLUG | 0.0% | 1.9% | $0 | PLUG POWER INC | 1 | $8 | $9 |
| $53 | NTDOY | 0.2% | 0.8% | $0 | NINTENDO CO LTD UNSP ADS | 5 | $11 | $11 |
| $287 | VWO** | 1.3% | 0.3% | $1 | VANGUARD INTL EQUITY INDE | 7 | $41 | $41 |
| $171 | JD | 0.8% | 0.2% | $0 | JD.COM INC SPON ADS EACH | 5 | $34 | $34 |
| $68 | AAP | 0.3% | 0.0% | $0 | ADVANCE AUTO PARTS INC | 1 | $68 | $68 |
| $405 | ALLY** | 1.8% | 0.0% | $0 | ALLY FINANCIAL INC COM US | 14 | $29 | $29 |
| $29 | CFG | 0.1% | -0.3% | $0 | CITIZENS FINL GROUP INC C | 1 | $29 | $29 |
| $114 | XOM | 0.5% | -1.1% | -$1 | EXXON MOBIL CORP | 1 | $115 | $114 |
| $56 | BUD | 0.3% | -1.4% | -$1 | ANHEUSER-BUSCH INBEV SA/N | 1 | $57 | $56 |
| $86 | BMO | 0.4% | -2.4% | -$2 | BANK OF MONTREAL COM NPV | 1 | $88 | $86 |
| $435 | BAC | 1.9% | -3.7% | -$17 | BANK AMERICA CORP COM | 15 | $30 | $29 |
| $189 | SWK | 0.8% | -4.0% | -$8 | STANLEY BLACK & DECKER IN | 2 | $98 | $94 |
| $335 | GM** | 1.5% | -4.4% | -$15 | GENERAL MTRS CO COM | 10 | $35 | $34 |
| $356 | BND** | 1.6% | -5.5% | -$21 | VANGUARD BD INDEX FDS TOT | 5 | $75 | $71 |
| $222 | USB** | 1.0% | -6.6% | -$16 | US BANCORP | 6 | $40 | $37 |
| $231 | WBD | 1.0% | -9.3% | -$24 | WARNER BROS DISCOVERY INC | 20 | $13 | $12 |
| $51 | MHK | 0.2% | -11.5% | -$7 | MOHAWK INDUSTRIES COM USD | 0.5 | $115 | $102 |
| $72 | ZM** | 0.3% | -12.0% | -$10 | ZOOM VIDEO COMMUNICATIONS | 1 | $82 | $72 |
| $132 | KSS | 0.6% | -12.6% | -$19 | KOHLS CORP COM | 5 | $30 | $26 |
| $80 | JWN** | 0.4% | -13.7% | -$13 | NORDSTROM INC COM NPV | 5 | $19 | $16 |
| $333 | C | 1.5% | -14.5% | -$56 | CITIGROUP INC | 8 | $49 | $42 |
| $25 | CWEN | 0.1% | -14.7% | -$4 | CLEARWAY ENERGY INC CL C | 1 | $29 | $25 |
| $214 | MMM** | 0.9% | -14.9% | -$38 | 3M CO | 2 | $126 | $107 |
| $91 | LBRDK** | 0.4% | -16.1% | -$17 | LIBERTY BROADBAND CORP CO | 1 | $109 | $91 |
| $225 | MRNA | 1.0% | -16.2% | -$44 | MODERNA INC COM | 2 | $134 | $113 |
| $163 | DIS** | 0.7% | -16.8% | -$33 | DISNEY WALT CO COM | 2 | $98 | $82 |
| $216 | TFC | 1.0% | -17.1% | -$45 | TRUIST FINL CORP COM | 7 | $37 | $31 |
| $28 | BEPC | 0.1% | -17.6% | -$6 | BROOKFIELD RENEWABLE CORP | 1 | $34 | $28 |
| $11 | SBGI | 0.1% | -23.2% | -$3 | SINCLAIR INC CL A | 1 | $15 | $11 |
| $127 | PYPL | 0.6% | -23.4% | -$39 | PAYPAL HLDGS INC COM | 2 | $83 | $64 |
| $48 | HIW | 0.2% | -23.9% | -$15 | HIGHWOODS PROPERTIES INC | 2 | $32 | $24 |
| $61 | VFC | 0.3% | -24.7% | -$20 | V F CORP COM NPV | 3 | $27 | $20 |
| $74 | JBSAY | 0.3% | -25.6% | -$25 | JBS SA SPON ADR EACH REP | 10 | $10 | $7 |
| $136 | WB** | 0.6% | -28.5% | -$54 | WEIBO ADR REP 1 CL A ORD | 10 | $19 | $14 |
| $106 | FLWS | 0.5% | -30.2% | -$46 | 1 800 FLOWERS COM INC CL | 15 | $10 | $7 |
| $41 | BAX | 0.2% | -30.4% | -$18 | BAXTER INTERNATIONAL INC | 1 | $58 | $41 |
| $137 | PARA** | 0.6% | -37.0% | -$80 | PARAMOUNT GLOBAL CLASS B | 10 | $22 | $14 |
| $70 | WBA | 0.3% | -40.7% | -$48 | WALGREENS BOOTS ALLIANCE | 3 | $40 | $23 |
| $131 | HBI** | 0.6% | -44.2% | -$104 | HANESBRANDS INC COM USD0. | 25 | $9 | $5 |
| $24 | KIRK** | 0.1% | -48.2% | -$23 | KIRKLANDS INC COM | 10 | $5 | $2 |
| $20 | ILPT** | 0.1% | -54.3% | -$24 | INDUSTRIAL LOGISTICS PPTY | 5 | $9 | $4 |
| $28 | FTCH** | 0.1% | -57.5% | -$38 | FARFETCH LTD COM USD0.04 | 10 | $7 | $3 |
| $60 | DISH | 0.3% | -68.1% | -$127 | DISH NETWORK CORPORATION | 10 | $19 | $6 |
| $5 | BBBYQ | 0.0% | -94.6% | -$91 | BED BATH AND BEYOND COM U | 20 | $5 | $0 |
| $0 | SBNY | 0.0% | -100.0% | -$243 | SIGNATURE BANK | 2 | $121 | $0 |
*Now for sale long (bought in August 2022)